Linda A. Jacobsen
Senior Fellow


Senior Fellow
The unprecedented size of the baby boom generation has presented unique challenges to U.S. institutions, infrastructure, and the economy as they have passed through each major stage of life. As boomers move into retirement and beyond, we reexamine their characteristics and differences from preceding generations to enable policymakers to accurately assess the potential social and economic implications of their aging and retirement.
Although baby boomers were the largest generation for decades, that is no longer true. The nearly 69 million baby boomers between ages 58 and 76 are outnumbered by about 70 million Gen Xers (ages 41 to 57) and 72 million Millennials (ages 25 to 40).1 And, despite declining fertility rates in the United States, boomers are also outnumbered by children under age 18 (72 million). However, they do still significantly outnumber the generations born before 1946, of whom there are only about 19 million, now ages 77 and older. (See Figure 1.) Clearly, boomers will transform the characteristics of the oldest age groups as they move into them.
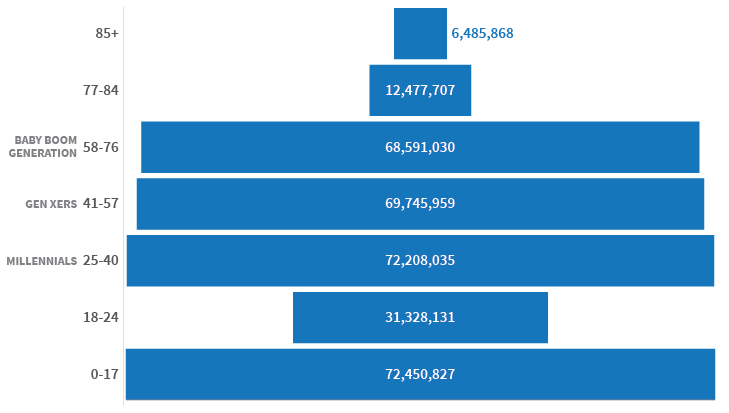
Download data ⇣ | Source: U.S. Census Bureau, Vintage 2022 Population Estimates.
Many people assume that nearly all baby boomers have already reached age 65, but that’s not the case! More than 4 in 10 boomers (43%) were still under age 65 in 2022. (See Figure 2.) Figure 3 shows this generation as a share of total population and of different age groups today and projected to 2030, when all boomers will have reached ages 65 and older.2 Boomers comprise only 21% of the total U.S. population today, a share projected to decrease slightly to 17% by 2030. Often there’s a tendency to treat the entire age group 65+ as being synonymous with the baby boom generation but, in fact, boomers make up only two-thirds of the total population ages 65+ today. However, this share is projected to rise to 82% by 2030: While boomers make up only 29% of the population ages 75 to 84 today, they’re projected to increase to 100% of this age group by 2030. No baby boomers are age 85 or older today, and none will reach this age group by 2030.
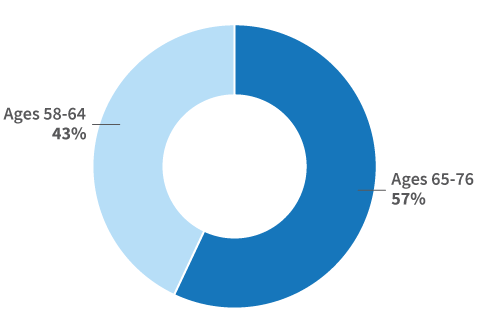
Download data ⇣ | Source: U.S. Census Bureau, Vintage 2022 Population Estimates and Projected Population by Single Year of Age, Sex, Race, and Hispanic Origin: Main Projections Series for the United States, 2022-2100.
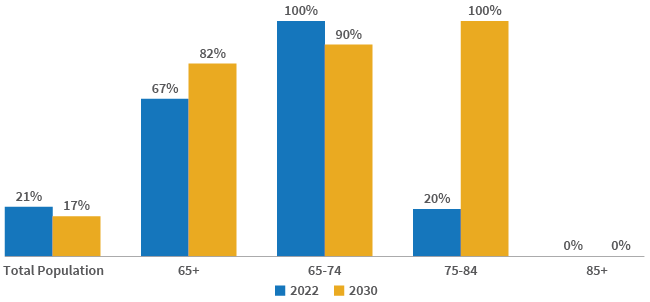
Download data ⇣ | Source: U.S. Census Bureau, Vintage 2022 Population Estimates and Projected Population by Single Year of Age, Sex, Race, and Hispanic Origin: Main Projections Series for the United States, 2022-2100.
As a share of total county population, baby boomers ages 60 to 74 are concentrated in many states across the United States in addition to the stereotypes of Florida and Arizona.3 (See Figure 4.) The higher boomers’ share of the total county population, the more potential impact they’re likely to have on that county’s economy and resources. At the national level, boomers ages 60 to 74 make up 16.5% of the total population, but at the county level the share ranges from a low of 5% to a high of 38%. Only 23% of the 3,144 U.S. counties (721) have a share of boomers below the national average. Conversely, they make up 20% or more of the population in 36% of counties (1,121) across the United States.
!function(){“use strict”;window.addEventListener(“message”,(function(a){if(void 0!==a.data[“datawrapper-height”]){var e=document.querySelectorAll(“iframe”);for(var t in a.data[“datawrapper-height”])for(var r=0;r<e.length;r++)if(e[r].contentWindow===a.source){var i=a.data["datawrapper-height"][t]+"px";e[r].style.height=i}}}))}();
Source: U.S. Census Bureau, Vintage 2022 Population Estimates.
The county with the highest concentration of boomers, at 38%, is in Florida—Sumter County, home to The Villages, one of the largest planned retirement communities in the country. The remaining top 10 counties where baby boomers are one-third or more of the population are scattered across the states from Washington to South Carolina. (See Table 1.) Two of the counties with the highest concentrations of this population (Sumter, Florida, and Brunswick, North Carolina) are part of metropolitan areas and represent popular retirement destinations. Brunswick County is just north of Myrtle Beach, South Carolina, and includes the city of Wilmington. In contrast, the other 8 counties in the top 10 have small populations and represent nonmetropolitan or more rural places where boomers have likely aged in place. Many of these counties have state parks, national forests, lakes, and other attractions offering recreational activities for tourists.
| wdt_ID | State | County | Ages 60-74 (%) | Ages 60-74 (Number) | Total County Population |
|---|---|---|---|---|---|
| 1 | Florida | Sumter | 37.8 | 54,866 | 144,970 |
| 2 | New Mexico | Catron | 37.1 | 1,420 | 3,827 |
| 3 | Colorado | Custer | 36.0 | 1,923 | 5,335 |
| 4 | Texas | Jeff Davis | 35.8 | 682 | 1,903 |
| 5 | Virginia | Highland | 34.1 | 785 | 2,301 |
| 6 | Washington | Jefferson | 34.1 | 11,454 | 33,589 |
| 7 | Michigan | Ontonagon | 33.3 | 1,952 | 5,863 |
| 8 | South Carolina | McCormick | 33.3 | 3,253 | 9,764 |
| 9 | Michigan | Alcona | 32.7 | 3,406 | 10,417 |
| 10 | North Carolina | Brunswick | 32.6 | 49,938 | 153,064 |
Source: U.S. Census Bureau, Vintage 2022 Population Estimates.
Many analyses of baby boomers focus on them as a single group—comparing them with other generations like Millennials and Gen X—rather than looking at the diversity within.4 Contrary to the myth of one uniform group, older and younger boomers have notable differences in racial and ethnic diversity, educational attainment, employment status, and technology use, and it is important to distinguish between them when considering these characteristics.
Boomers under age 65 are more racially and ethnically diverse than those ages 65 and older—68% of younger boomers are non-Hispanic white and 32% identify with another racial or ethnic group compared with 73% and 27% respectively among those ages 65 to 75. (See Figure 5.) The diversity gap between generations is even wider when younger boomers are compared with members of the Millennial and post-Millennial generations. For example, only 54% of Millennials and 49% of post-Millennials identify as non-Hispanic white, while 46% and 51% respectively identify with another racial or ethnic group.
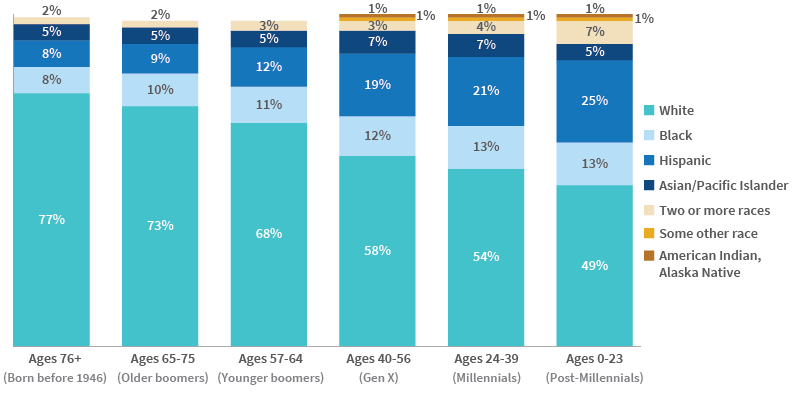
Download data ⇣ | Note: Racial groups exclude Hispanics and are race alone, with the exception of the two+ races category. Racial groups whose percentage rounds to less than 1% are not displayed. The total percentages for each age group may not sum to 100% due to rounding.
Source: U.S. Census Bureau, 2021 American Community Survey; and IPUMS USA, University of Minnesota, www.ipums.org.
The differences in older and younger boomers’ racial and ethnic composition are important because they’re linked to disparities in economic well-being. Ten percent of white boomers under age 65 had family incomes below the poverty threshold, while this share rose to 14% and 22% among their Hispanic and Black peers, respectively.5 Despite having reached eligibility for Medicare and Social Security programs at age 65, these racial and ethnic disparities persist among older boomers ages 65 to 75. Among this age group, 17% of Hispanic and 19% of Black boomers had family incomes below the poverty threshold compared with just 8% of their white peers.
Educational attainment is similar among younger and older boomer women—just over 30% of both groups have completed a bachelor’s degree or more, and fewer than 3 in 10 stopped their education after high school. Notable differences, however, are evident between younger and older boomer men. While more than one-third (35%) of men ages 65 to 75 have completed a bachelor’s degree or more, only 30% of those under age 65 have done so. Similarly, only 26% of older baby boomer men did not complete any additional education beyond high school, compared with 31% among younger men of this generation.
Another important distinction between older and younger boomers is employment status. Not surprisingly, employment rates remain high among boomers under age 65—66% for men and 56% for women. (See Figure 6.) However, labor force participation rates—which include employed persons and those looking for work—have been increasing since the 1990s among both men and women ages 65 and older in the United States.6 This trend is reflected in baby boomers ages 65 to 75 with nearly 3 in 10 men and 1 in 5 women still employed. Among those ages 76 and older (born before 1946) employment rates are very low.
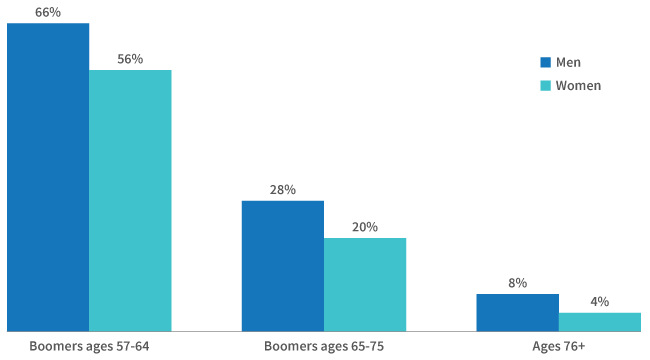
Download data ⇣ | Source: U.S. Census Bureau, 2021 American Community Survey; and IPUMS USA, University of Minnesota, www.ipums.org.
Grouping everyone ages 65 and older into a single category when discussing older adults masks important distinctions between boomers ages 65 to 75 and adults ages 76 and older who were born before 1946. For example, both older boomer men and women have completed higher levels of education than men and women ages 76 and older. The sharpest differences are among women—only 29% of boomer women ages 65 to 75 completed high school but no college compared with 38% of women ages 76 and older.7 While 30% of older boomer women completed a bachelor’s degree or more, this share is only 22% among women born before 1946.
Although boomers are often assumed to be healthier at older ages than the generations that preceded them, the data reveal a mixed picture. Boomers ages 65 to 74 report fewer disabilities than adults ages 75 and older—only 13% have one or more disabilities compared with 26% among those ages 75 and older (See Figure 7). However, other data indicate that baby boomers are more likely to have activity limitations at ages 55 to 60 than members of older generations at the same ages.8 Although research finds that boomers are less likely to smoke or have emphysema or heart attacks, they are more likely to be obese or have diabetes or high blood pressure than the previous generation at similar ages.9 About one-third of older boomers are obese compared with only one-quarter of those ages 75 and older. This trend is concerning because higher levels of obesity among older boomers may lead to poorer health outcomes as they move into the oldest age groups. About one-fifth of both older boomers and adults ages 75 and older have been diagnosed with diabetes.
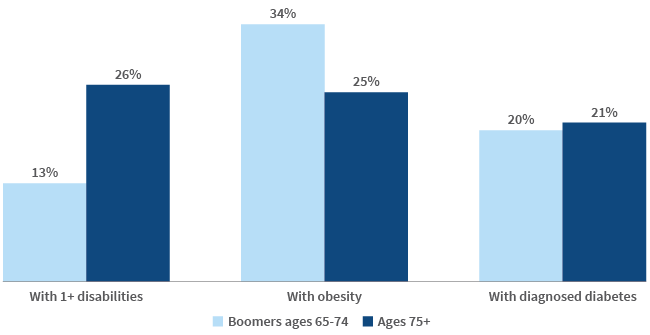
Download data ⇣ | Note: The sample includes only the civilian noninstitutionalized population.
Source: National Center for Health Statistics, 2022 National Health Interview Survey.
Another common misconception about those ages 65 and older is that a substantial share live in group quarters such as nursing homes. In fact, only 1% of baby boomers ages 65 to 75 live in group quarters. This share reaches 5% among those ages 76 and older. Despite higher rates of divorce among baby boomers, about three-fifths of older boomers (62%) still live in married couple households, compared with only 48% of adults ages 76 and older.10 (See Figure 8.) This gap between those under and over age 75 is also due in part to higher levels of mortality at ages 76 and older. Women over age 75 are much more likely to live alone than boomer women—23% compared with 14%, again reflecting higher mortality at older ages as well as lower rates of re-partnering after divorce or widowhood.11 Only 9% of boomer men and men ages 76 and older live alone. Women in both age groups are twice as likely as men to head households without spouses or partners that include relatives or non-relatives.
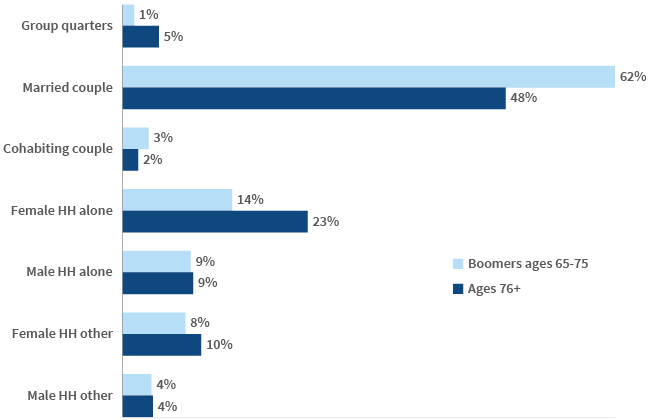
Download data ⇣ | Note: The categories Male and Female HH Other include householders without a partner or spouse, living with own children, other relatives, or non-relatives.
Source: U.S. Census Bureau, 2021 American Community Survey; and IPUMS USA, University of Minnesota, www.ipums.org.
Finally, although they’re often characterized as technology-averse, households headed by both younger and older baby boomers are much more likely than households headed by adults ages 76 and older to have at least one computer such as a desktop, laptop, or tablet, and a smartphone at home. (See Figure 9.) Among households with a paid subscription to an internet service provider, those headed by boomers are also slightly more likely than those headed by adults ages 76 and older to have high-speed or broadband internet connections at home. Technology use among households headed by boomers under age 65 is higher than among households headed by boomers ages 65 and older—particularly for smartphones (90% compared with 83% respectively). The lower shares of households headed by both older boomers and adults ages 76 and older with paid, high-speed internet connections at home may be due in part to the lack of infrastructure in some of the more rural areas where adults ages 65 and older have aged in place.
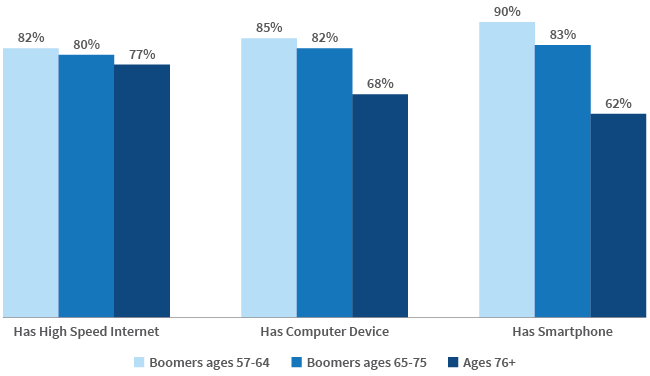
Download data ⇣ | Note: High speed includes cable, fiber optic, or DSL. Computer devices include desktop, laptop, tablet, or other computer.
Source: U.S. Census Bureau, 2021 American Community Survey; and IPUMS USA, University of Minnesota, www.ipums.org.
Neither baby boomers nor all adults ages 65 and older are monolithic groups. There are important differences in characteristics between younger and older boomers and between boomers and members of preceding generations born before 1946. Today, the entire age group of 65- to 74-year-olds is made up of baby boomers, and by 2030, they’re also projected to be 100% of the age group 75 to 84. The differences in characteristics between baby boomers and the generations that preceded them will result in significant changes within the U.S. population ages 65 and older. Careful evaluation of these intergenerational differences will enable policymakers to more successfully prepare for the future as the baby boom generation ages.