John Haaga
Former Director of Domestic Programs

On May 24, 1924, President Calvin Coolidge signed into law the Immigration Act of 1924, one of the strictest restrictions on immigration in the nation’s history.1 The law limited the total number of immigrants who could come to this country, imposed quotas on immigration from each European nation, and banned almost all immigration from Asia. It had an immediate impact, reducing the number of immigrants from over 700,000 the year before its passage to fewer than 300,000 the year after.
With a few changes to accommodate displaced persons after World War II and Cold War refugees, the restrictive system set in place by the 1924 act lasted until 1965, when a new law ushered in a new era of increased immigration, removing the national quotas and prioritizing family reunification in admission decisions.
Today, a century after the 1924 act, legal immigration to the United States occurs through multiple pathways, including family relationships, ties to employers, and humanitarian protection, but millions of foreign-born residents are also “unauthorized,” having “entered the United States without inspection, overstayed a period of lawful admission, or violated the terms of their admission.”2 Who should be allowed to enter the United States, and under what circumstances, has become a leading—and divisive—issue for policymakers and voters alike. To help in thinking through issues and alternative policies, it’s important to know some basics about who the immigrants are now and how they came to be here.
In 2022, there were just over 46 million foreign-born people living in the United States, equating to 13.8%—about one in seven—of the total U.S. population.3 The foreign-born population is the largest ever, though its share of the total population was higher in the early 1900s (Figure 1).
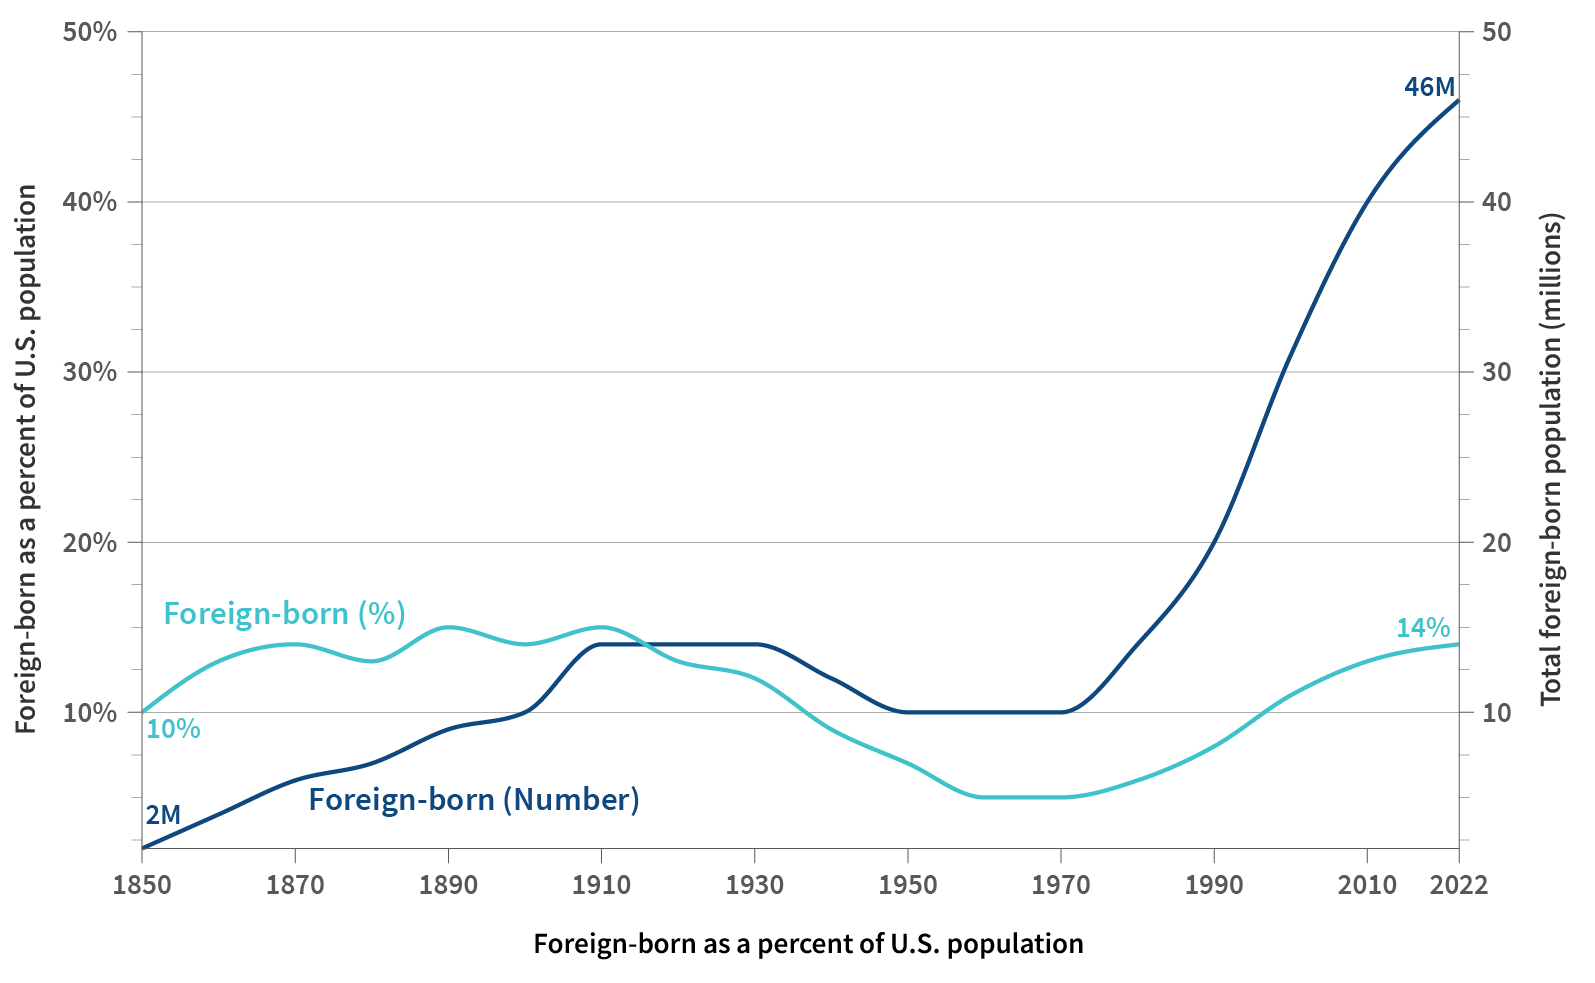
Source: Migration Policy Institute, U.S. Immigrant Population and Share over Time, 1850-Present, https://www.migrationpolicy.org/programs/data-hub/charts/immigrant-population-over-time.
The U.S. foreign-born population is a diverse group. Of the 46 million Americans born outside the country, half were born in Latin America (Mexico, Central and South America), 31% in Asia, and 10% in Europe (Figure 2). Some 36.5 million are naturalized citizens of the United States. Of the noncitizen residents, just over half (12.9 million) are lawful permanent residents (often called green card holders). There is no precise count of who has entered the country unofficially, but in 2022, it was estimated that between 10.3 and 11.4 million people living in the United States were unauthorized immigrants.4
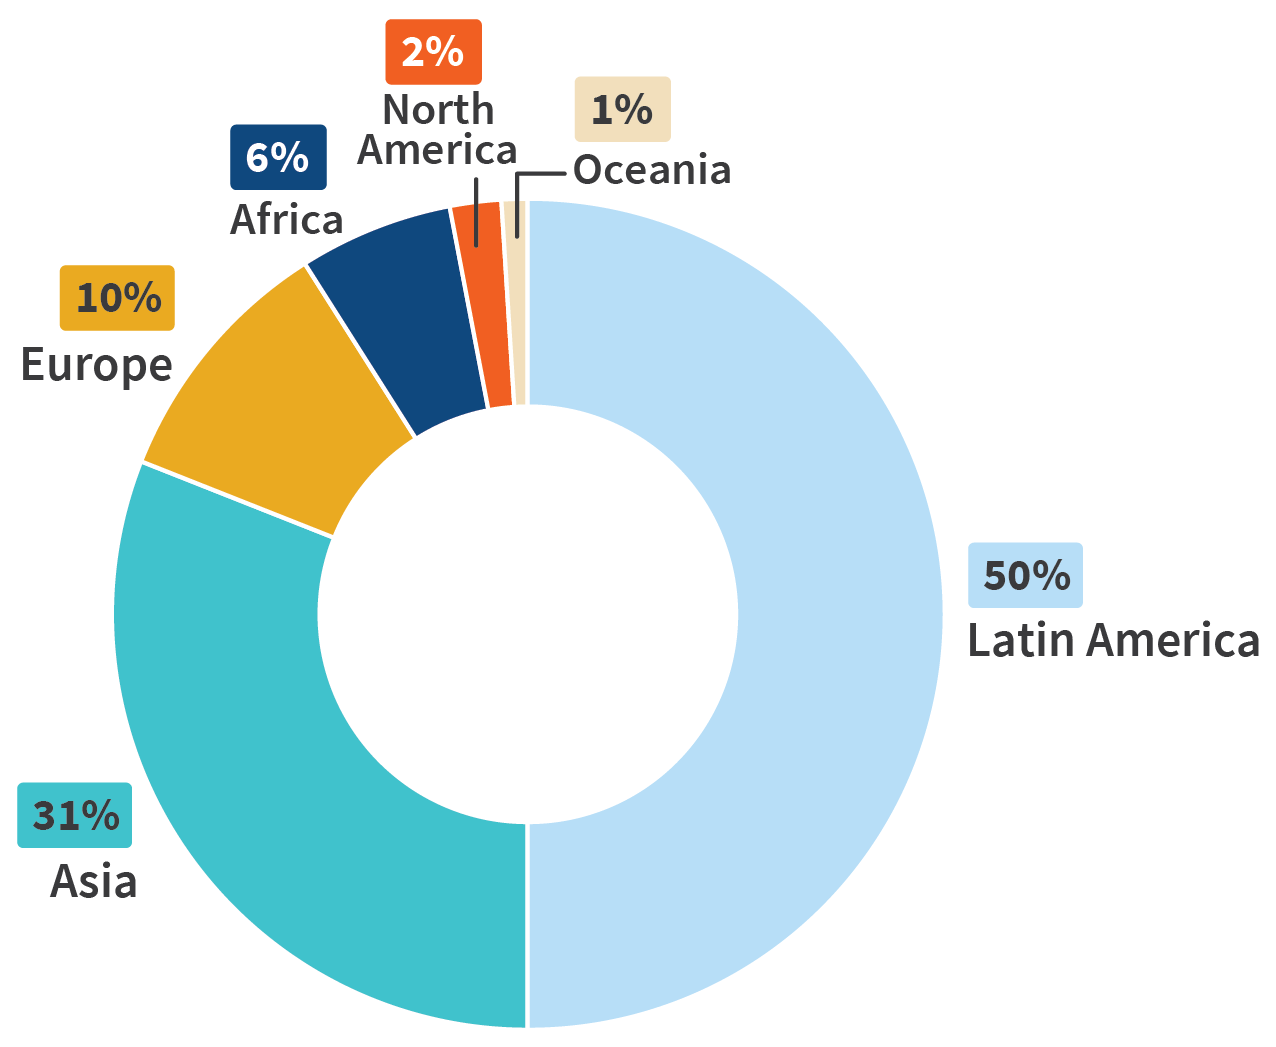
Source: U.S. Census Bureau, 2022 American Community Survey.
Of the latter, some proportion will get a green card and stay as permanent residents, some will finish their studies or job and leave the United States, and some will stay after their temporary visa has expired—which is one way that unauthorized immigrants enter the country.
The U.S. Census Bureau, which conducts the decennial census and the American Community Survey, is the main data source for these so-called stock estimates—how many foreign-born residents of a certain type are living in the United States at a particular time? The U.S. Department of Homeland Security is the main data source for so-called flow estimates—how many people enter the United States, or change their immigration status, during a year?
Of just over 1 million legal immigrants arriving (or changing status) in 2022, by far the largest group (428,000) were immediate family members of U.S. citizens, including spouses, parents, or minor children (Table 1). Immediate family members of U.S. citizens are not subject to an overall limit, so the total number of legal immigrants is not fixed.5
| wdt_ID | Class | Number of immigrants |
|---|---|---|
| 2 | Immediate relatives of US citizens | 428,268 |
| 3 | Family-sponsored | 166,041 |
| 4 | Employment-based | 270,284 |
| 5 | Diversity | 43,233 |
| 6 | Refugees and asylees | 83,082 |
| 7 | Other | 27,441 |
| 8 | Total | 1,018,349 |
Source: Department of Homeland Security, Yearbook of Immigration Statistics, 2022.
Also in 2022, another 166,000 legal immigrants received permanent resident visas under “family-sponsored preferences.” These individuals include immediate family members of U.S. legal permanent residents (not citizens) and other relatives of both citizens and permanent residents, such as siblings, nieces, and nephews.
The second-largest group of legal immigrants (270,000) received employment-based preferences, such as those who entered on H1B visas sponsored by their employers. So-called diversity visas, allocated by lottery to qualified applicants from countries that have not had many permanent resident visas in recent years, were issued to 43,000 people. Intricate sets of rules govern the allocation of visas under all these categories.
For refugees and individuals seeking asylum who came to the United States (83,000 people in 2022), special allowances are made annually. The number of refugees to be admitted each year is set by the president in consultation with Congress. In FY2022, the cap was set at 125,000, though the number actually admitted was smaller, due to backlogs in vetting applicants, processing visas, and resettling those admitted. The most common countries of origin among U.S. refugees in FY2022 were Congo, Syria, Burma, Sudan, and Afghanistan.6
The eligibility criteria for refugee and asylum admissions are similar. In both cases, applicants must prove that they have either experienced persecution in the past or have a well-founded fear of persecution in the future while in their home country. Persecution is defined as a serious threat to life or freedom, on one or more of the following grounds: race, religion, nationality, political opinion, or membership in a persecuted social group. Those previously convicted of a serious crime or terrorism or who have themselves persecuted others are ineligible.
Refugees are those who apply while still outside the United States; they need to show financial sponsorship by a person or organization within the United States, and many receive assistance with their travel and resettlement. Refugees are eligible to work legally upon arrival. Those seeking asylum, by contrast, apply either in the United States (having entered either with a temporary visa or without authorization) or at a port of entry, including a border crossing.
Some of the unauthorized immigrants now residing in the United States got here by crossing a border undetected (in official statistics, entered without inspection, or EWI). Of these, some apply for asylum status, and others simply blend into the resident population.7
A large share of unauthorized immigrants (about half, according to recent estimates) do not enter the country undetected; they enter on a valid temporary visa but stay past its expiration. The most recent report, for FY2022, estimated that more than 96% of the 23 million individuals visiting the country with nonimmigrant visas who had arrived at ports of entry (sea or air) who were expected to leave during the year did so. But that still left some 854,000 people who overstayed their visas, some of whom will leave eventually and some who will stay. Millions of people visit the United States temporarily each year; even the small number who overstay is not much smaller than the number of legal immigrants each year.
Before the COVID-19 pandemic, about 9–10 million nonimmigrant visas were issued each year, for tourists, businesspeople, and workers sponsored by their employers, conference attendees, athletes, entertainers, and others. The Department of Homeland Security reports to Congress each year on the number of people who overstay these temporary visas, based on matching exit records to the number of visas issued in previous years that should have expired during the most recent year.
Two distinct groups within the unauthorized immigrant population receive particular attention. Those who were brought to the United States as children can apply for a work permit and two years’ protection from deportation under the Deferred Action for Childhood Arrivals (DACA) program. DACA was set up by executive order of the president in 2012. DACA was intended as a temporary measure pending congressional action on broader immigration reform; it does not entitle recipients to a green card or provide a path to citizenship. The Migration Policy Institute estimated that there were 545,000 DACA recipients living in the United States in 2023.8
People arriving from certain countries beset by civil conflict or natural disasters can apply for temporary protected status (TPS), which allows them to remain in the United States, and work, until conditions improve in their home country. Currently 16 countries of origin are designated for TPS, and nearly 700,000 people are in TPS. Since the Russian invasion of Ukraine in February 2022, those fleeing Ukraine have become eligible for TPS, and a special accelerated visa program called Uniting for Ukraine has approved more than 236,000 cases as of March 2024, with 187,000 already arrived in the United States.
At least since the late 1800s, Americans have always argued, sometimes vehemently, about the desired number of immigrants, which persons deserve priority, and how (and how strictly) to enforce immigration laws.9 At rare times, new laws have produced comprehensive immigration reform. More commonly, the intense focus is on subsets of immigrants and specific types of enforcement—at present, stopping unlawful border crossings and deterring asylum seekers dominate the discourse.
Almost by definition, it is hard to count unauthorized immigrants. They are often missed in national surveys because of their living arrangements (in worker barracks or multi-family housing, for example) and fear of government authorities.10 The Census Bureau does not directly ask respondents about immigration status, though it does ask about place of birth. In the absence of direct counts, analysts use indirect methods of estimating the population. None of these are perfect; all involve making assumptions.
One set of estimates of unauthorized immigrants come from the Pew Research Center, a nonpartisan think tank that has produced careful research on immigration for decades, with clear explanations of their methods.
Pew’s basic approach is to first use estimates of the total U.S. resident population, based on the decennial census, the American Community Survey, and, for older estimates, the Current Population Survey, with adjustments for likely undercounts in these data. Then they subtract estimates of the legal immigrant population from each of those totals, based on flow statistics in recent years for many categories of visa holders. The remainder—again adjusted for likely undercounts—is an estimate of the unauthorized population.
The Center for Immigration Studies, which advocates for reduced immigration, uses an analogous approach but prefers the Current Population Survey instead of the American Community Survey as a base for estimation. They estimated that in January 2022 there were 11.46 million unauthorized immigrants (higher than Pew Research Center’s estimate for 2021.)11
Many Americans rate immigration as an important issue in their voting decisions; in a recent Pew survey, 57% of Americans said immigration was a top policy priority for 2024.12 Yet even as immigration has been a key part of American history, it is also seen as a highly partisan issue that often divides people and political parties. As we approach the presidential election, understanding the history of immigration to the United States can help put these current debates in context and point the discourse toward evidence-based solutions.