Toshiko Kaneda
Technical Director, Demographic Research


Technical Director, Demographic Research

Senior Program Director
Over the past five decades, the global average fertility rate has fallen from about 4 children per woman to 2.2 today. Two-thirds of the world’s population now lives in countries where the total fertility rate is below the replacement level of 2.1 (see Figure 1). This includes almost all high-income countries and much of Asia, Latin America, and the Caribbean. Fertility remains highest in sub-Saharan Africa, parts of South Asia, and some Pacific islands, though rates are gradually declining.

Even as global fertility converges downward, significant variation remains (see Figure 2). In Africa, fertility is still 4.1 children per woman, but with wide variation across countries, from 1.2 (Mauritius) to 6.0 (Chad). Even regions with low average fertility, like Asia and the Americas, have large differences within and across countries.

As fertility falls, populations age, creating new social and economic pressures. This guide explains what’s behind falling fertility rates, unpacks common assumptions about fertility decline, and explores how policymakers can respond. It aims to spark informed, data-driven dialogue and reporting that shifts the focus from fear to facts and from panic to practical solutions that support societies to adapt and thrive.
Fact: To understand fertility, demographers look at three factors: preferences (the number of children people would ideally like to have), intentions (the number of children people realistically plan for, given their circumstances), and behaviors (the actual number of children people end up having). Even in low fertility countries, most people still want children—but preferences often exceed intentions, and intentions often exceed actual births.
Childbearing is reduced both by shifting priorities (valuing careers, leisure, and personal fulfillment over marriage and larger families) and by constraints such as high costs, work-family conflict, unequal gender roles, economic insecurity, delays in partnering, and changing cultural norms.
Unknown: What factors, if any, can narrow gaps across fertility preferences, intentions, and behaviors. These factors can help explain how people plan for families, but there are some limitations. This information is collected through surveys, which are subject to bias; for instance, we know that societal expectations can lead some people to report wanting children, even if they’re unsure or don’t plan to. Additionally, survey results provide a snapshot in time, but preferences and intentions about children can and do shift. For example, younger people often plan for more children but adjust their intentions as life circumstances change. This can contribute to confusion about how individual choices are connected to fertility rates.
Fact: Comprehensive global reviews find no strong evidence that infertility is increasing, so it cannot explain the widespread decline in fertility rates. Measuring infertility is challenging, as definitions and data vary across countries.
Worldwide, about one in six people experience infertility—not becoming pregnant after 12 months of unprotected sex—at some point in their lives. Rising childlessness is mostly shaped by social and economic factors, described above. Still, some trends, like having children later, can influence both infertility and fertility decline since delaying pregnancy shortens the reproductive window and biological ability to have a baby reduces as maternal age increases.
Unknown: Reliable infertility data are still limited in many countries, making it difficult to track trends or separate true biological infertility from voluntary delays and decisions to have fewer children. It also remains unclear how much lifestyle and environmental factors—such as stress, pollution, or obesity—might contribute to infertility trends.
Fact: Cash incentives and tax breaks given to parents tend to create only modest, short-term increases in births, often encouraging people to have children sooner, but with limited impact on overall births.
While such benefits can ease the financial burden of raising children in the short term, they typically make up only a small share of household income. It is possible that larger, long-term incentives could yield more births, but raising fertility to replacement levels this way would likely be prohibitively expensive.
Unknown: If financial incentives would have a stronger effect if paired with generous family support policies (see below).
Fact: Designed to make it easier for couples to work and raise children, these policies have only modest effects on fertility, often encouraging parents to have additional children but not people without children to enter parenthood.
However, such programs remain important for their other benefits, including reducing stress, improving well-being, and giving parents more options.
Unknown: Whether scaling up to universal, generous family supports could help close the gap between intended and actual births, or whether cultural and economic drivers will keep fertility low regardless. We also don’t know whether implementing such policies before the fertility rate declines below replacement level could help countries prevent or delay the decline to very low fertility; most countries with generous family supports only brought them on after fertility had already dropped.
Fact: Restrictive policies do not sustain higher fertility and come with serious health and human rights costs. Romania’s abortion ban in 1966 briefly doubled births, but fertility soon fell again while unsafe abortions, maternal deaths, and numbers of abandoned children soared.
Similarly, in the immediate aftermath of the 2022 Dobbs decision that overturned federal abortion protections in the U.S., states that enacted abortion bans saw a modest increase in births compared to projected trends (about 2–3% more than expected). However, total births continued to fall in most of states with bans, suggesting a temporarily slowing rather than a reversal. Limiting reproductive rights undermines health and freedom without addressing the real reasons families have fewer children.
Unknown: How far governments concerned about low fertility may go to restrict reproductive rights, and how such actions might backfire socially and politically.
Fact: Among high-income countries, those with lower gender equality (such as South Korea and Japan) tend to have lower fertility rates, while in those with higher gender equality—where caregiving and paid work are more equally shared—fertility tends to be somewhat higher.
Still, this pattern isn’t simple: We don’t know whether this relationship is causal, and some highly gender-equal countries (such as Norway and Sweden) also have very low fertility. In low-income countries with very high fertility, evidence does suggest that greater gender equality has contributed to fertility decline.
Unknown: Whether cultural norms will shift toward more equal sharing of work and caregiving, how meaningful those shifts might be, and whether they will raise fertility or primarily improve well-being (while fertility remains low).
Fact: Immigration can ease labor shortages and slow aging in the short to medium term. But immigration is rare (just 3-4% of the global population has migrated internationally) and as fertility falls worldwide, the global pool of young migrants will shrink, limiting immigration’s potential as a long-term solution.
Unknown: How much or where migration will actually flow in the future, and whether political and social systems will allow enough immigration to meaningfully ease pressures from aging.
Fact: Fertility decline leads to population aging—or, a growing share of older adults relative to younger people. At the family level, fewer children share the responsibility of supporting aging parents and grandparents, straining household finances. At the societal level, a shrinking pool of workers to retirees strains pension and health care systems and can slow economic growth. Population aging does strain retirement systems and shrink the workforce, but there is a lot societies can do to adapt.
Countries can experiment with a range of solutions such as adopting pension reform, raising the retirement age, getting more people into paid work, prioritizing immigration, and investing in productivity and innovation.
Unknown Whether these adaptations will be enough—since no society has ever faced aging on this scale and the pace of aging is rapid in low- and middle-income countries new to the trend.
Want to learn more about global fertility decline? Here we break down the key forces shaping global fertility patterns and what these shifts mean for families and societies, unpacking the demographic trends behind the assumptions discussed above.
Global fertility decline has been driven by lower child mortality, wider access to family planning, more education and jobs for women, and urbanization. The more recent decline to below-replacement and very low fertility levels reflects both economic challenges and broader social and cultural changes.
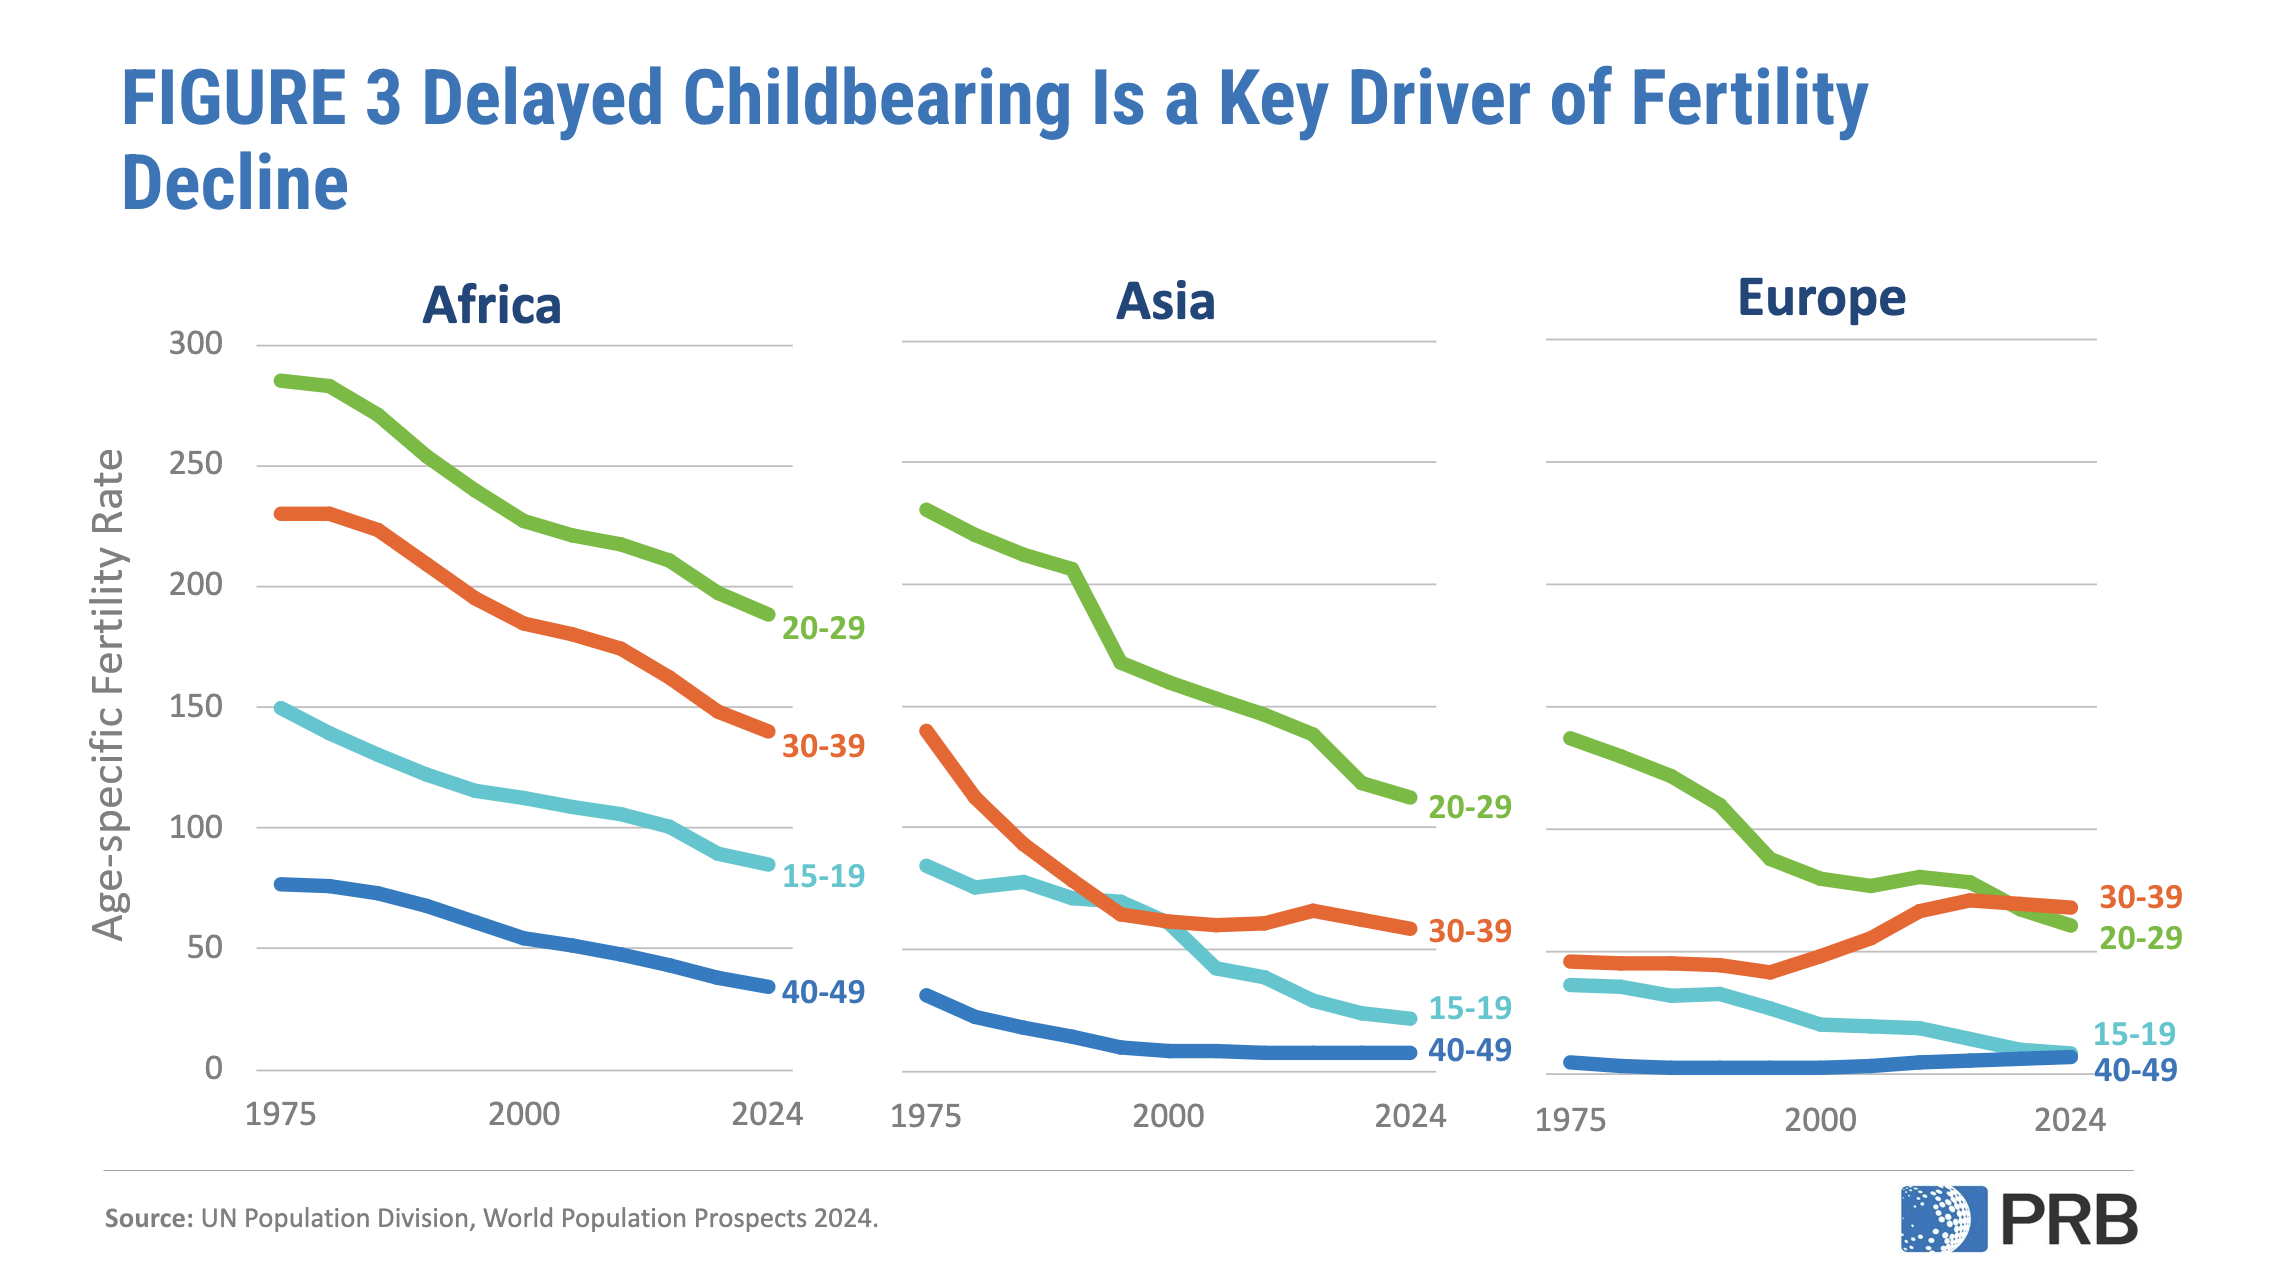
Rising costs, unstable jobs, delayed partnerships, and inflexible work environments make it harder to raise children, while greater emphasis on education, careers, and personal freedom has redefined ideas about family and what living a fulfilling life looks like (Figure 3). These factors explain why fertility is below replacement even where people still want children.
The total fertility rate is the average number of children a woman is expected to have over her lifetime if age-specific fertility trends prevail. It is a hypothetical measure based on current birth rate (importantly, it does not represent or predict the actual number of children women have). The replacement level fertility rate is the average number of children a woman needs to have for a population to replace itself from one generation to the next, assuming no migration and a natural sex ratio at birth (slightly more boys born than girls ). It is typically about 2.1 children per woman—two parents “replace” themselves with two children, plus an extra margin above zero because not all children survive to adulthood. However, even when fertility falls below 2.1 children per woman, population can continue to grow for several decades. That’s because many people are still in their childbearing years, so births remain high for decades, a pattern called population momentum.
The 2.1 figure can be a helpful benchmark for gauging whether populations might grow or shrink over time, even though actual replacement levels vary. But treating 2.1 as a “magic number” for stability is misleading: it ignores mortality and migration trends and says nothing about population momentum or population composition, such as age structure. Using 2.1 as a target fertility rate can also exacerbate fear about population decline and lead to policy solutions that focus only on raising birth rates. Such approaches can undermine reproductive rights, gender equality, and family well-being, while distracting from the rights-based priority of ensuring that people can have the number of children they want.
Population aging itself reflects progress: people living longer, healthier lives and women having more options and opportunities. Older adults are important contributors to societal and economic well-being, strengthening families and communities through caregiving, financial support, and volunteering. Many also remain in the labor force and could contribute even more with supportive policies. As societies adapt, population aging can also spur technological innovation, particularly in health care, assistive technologies, and automation, and even fuel a “silver economy” for goods and services for older adults. It also invites new thinking on gender roles, work-life balance, and more gender-equitable caregiving policies for both children and older adults.
Policymakers should focus first on helping women and families achieve the number of children they want. That means reducing the barriers between fertility preferences, intentions, and behaviors by investing in proven supports: affordable childcare, paid parental leave, flexible work arrangements, affordable housing, and gender equality in caregiving. These policies may not reverse fertility to “replacement level,” but they expand choices, improve well-being, and may close the gap between ideals and realities.
At the same time, evidence shows fertility is unlikely to return to past levels. Even if a country were to experience an unprecedented fertility rebound, it would take many decades to see the workforce or population grow again. Thus, societies must actively adapt rather than try to restore the past. Preparing for aging means strengthening pension and health systems, extending healthy working lives, investing in innovation and productivity, and expanding labor markets to engage groups typically underrepresented in paid work, including women, people with disabilities, older adults, and immigrants. Population aging is inevitable, but with adaptation, societal decline is not.
Too often, discussions about fertility decline center on the same tired question—“How do we get women to have more children?”—and end up with the same predictable answers. But there’s a much richer story to tell.
Around the world, new and overlooked ideas are emerging that can help families of all kinds thrive and help societies adapt to demographic change. Fresh angles to explore might include:
If you’re reporting on these issues, reach out—we’re here to help with data, context, and story ideas. To schedule an interview, please contact media@prb.org.

Technical Director, Demographic Research
Today, an estimated 7.2 million Americans ages 65 and older live with dementia. While conversations around dementia often evoke nursing homes, most older Americans living with dementia are actually aging in place in their homes. Home-based care has become more common over the last decade, partly because it is more affordable and aligns with what many people prefer.
People living with dementia often face both medical and practical barriers to obtaining care, including challenges with memory, decision-making, and mobility. These difficulties make access to effective care at home not just helpful but essential to supporting their ability to remain safely in the community.
Despite its benefits, home-based care is not without challenges, including the financial burden of paying out-of-pocket for services not covered by Medicare and Medicaid and the emotional toll on family members who often take on day-to-day caregiving responsibilities. Understanding how home-based care works for the growing population of older adults with dementia is critical for improving how dementia is managed in the community and providing better support for older adults and their families.
Home-based care typically falls into two categories: home health care and home care. Home health care refers to medical services provided by licensed professionals, including skilled nursing care, physical therapy, and medical social services. It is covered by Medicare if prescribed by a doctor or nurse practitioner. Home care refers to non-medical services to assist with housekeeping and the activities of daily living, such as bathing and dressing. Medicare does not cover home care unless it is provided with medical care, but Medicaid covers home care in some states.
Based on data from the Health and Retirement Study (HRS) and Medicare claims between 2012 and 2018, Julia Burgdorf and her colleagues found that approximately 30% of home health care users had a dementia diagnosis.1 Older adults with dementia were twice as likely to use home health care compared to those without dementia.
About half of those with dementia were referred to home health care without a preceding hospitalization, compared to slightly less than a third of those without dementia. This finding highlights the importance of home health care as a key source of clinical care for older adults with dementia, not just for recovery care, Burgdorf and her colleagues said.
Once enrolled in home health care, people with dementia received care more times (an average of 1.4 times compared to 1 time) and for longer periods (median of 56 versus 40 days) than people without dementia. They were also more likely to receive personal care, medical social work, and speech-language pathology services than those without dementia.
However, among people who received services, those with dementia had fewer visits for skilled nursing and physical therapy, the researchers found.
“Existing prospective payment structures incentivize HHC providers to limit the number of visits in order to lower costs and maximize profits,” they wrote. And “the 2020 implementation of a new Medicare HHC payment model, the Patient-Driven Groupings Model (PDGM), may further incentivize limiting visits for people living with dementia.”
The new payment model aims to reimburse providers based on how sick patients are—but it doesn’t directly account for dementia status, Burgdorf and team note. It also reduces reimbursement for community referrals, though many people with dementia enter care this way. Differences in coverage between Medicare Advantage (private plans) and fee-for-service (the traditional government-run plan), along with workforce shortages and fragmented care systems, may create additional barriers for people with dementia, they explain.
Burgdorf and colleagues suggest several ways to improve home health care for people with dementia, including:
Many older adults end up paying for home care out of pocket because long-term care is not included in Medicare, Medicaid coverage is inconsistent across states, and few people have private long-term care insurance, according to another analysis.
“The financial burden of out-of-pocket payment for home care is significant, particularly among people with dementia and those with limited income and wealth,” conclude Karen Shen and colleagues, who used Health and Retirement Study (HRS) data (2002-2018) to measure the financial burden of home care.
Home care also often results in ongoing expenses over a long period of time, unlike most other health care costs, they found.
In recent years, people with dementia made up one-third of an estimated 3 million people who received home care and almost half (45%) of the over 600,000 people who paid for at least some of this care out of pocket, according to the researchers.2 Among those with dementia who paid out-of-pocket, half (51%) spent over $1,000 per month, compared to one-fourth (26%) of those without dementia. Additionally, people with dementia were much more likely to pay for full-time help, defined as 40 hours or more per week, compared to those without dementia (46% versus 22%).
Although higher-income individuals are more likely to pay out-of-pocket, many people with lower incomes also do so, largely because those with fewer financial resources are disproportionately affected by disability and dementia, the authors note. In fact, about half of those paying for home care out of pocket were poor or near-poor, defying the common perception that private home care is used only by individuals with higher incomes.
Those who are poor and have dementia experienced disproportionate financial burdens, as they spent 87% of their household income on home care, compared to 32% spent by their peers without dementia, and 22% spent by high-income individuals with dementia (See figure).
These findings suggest that those with dementia and limited financial resources may not be getting the care they need.
“Policies aimed at easing the financial burden of home care are essential, particularly for low-income individuals with dementia who experience the greatest financial burden,” argue Shen and her colleagues.
They recommend policies to reduce unmet care needs and financial hardship while also making the system more equitable and responsive to the realities of aging at home with dementia, including:
To make these programs financially sustainable, they recommend targeting benefits to the most vulnerable individuals and incorporating cost-sharing mechanisms so that those with more resources help shoulder the cost of care.
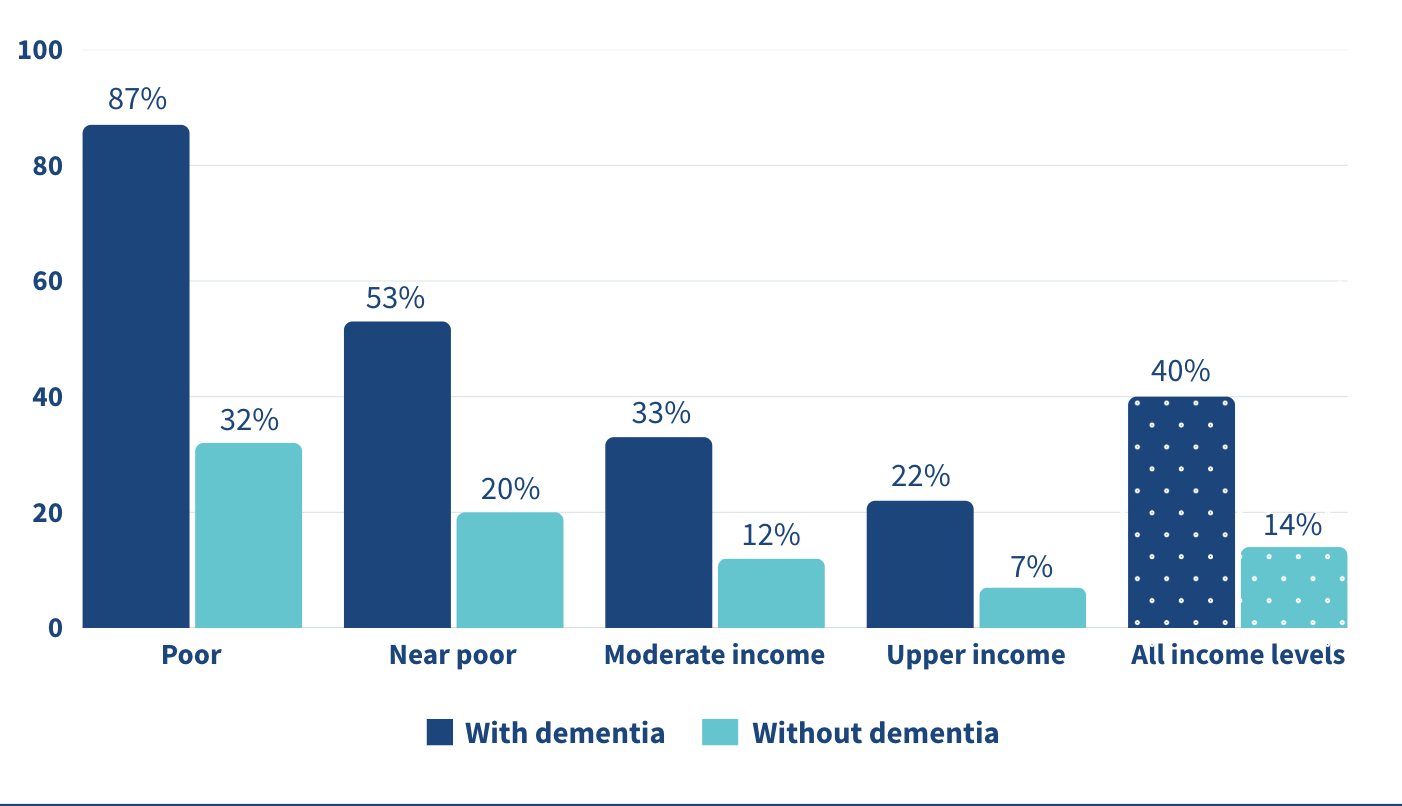
Note: “Poor”: 100% of the Federal Poverty Level (FPL); “Near-poor”: 100-200% of FPL; “Moderate-income”: 200-400% of FPL; and “Upper-income”: >400% of FPL.
Source: Karen Shen et al., “Paying for Home Care Out-of-Pocket Is Common and Costly Across the Income Spectrum Among Older Adults,” Health Affairs Scholar 3, no. 1 (2025).
Even with paid home care, most dementia care still falls on family and friends. In the United States, over 11 million unpaid caregivers provide over 15 billion hours of dementia care every year, according to Yeunkyung Kim and his colleagues.3 One way to give caregivers a break is through respite care—short-term care that lets family members step away for a few hours or days. Ultimately, respite care aims to help sustain caregiver health and delay the institutionalization of the people in their care.
Yet its use remains limited. Only 16% of Black caregivers used respite services compared to 32% of white caregivers in 2015, representing a significant gap of 12 percentage points, Kim and team found. Although this racial gap had been reduced or eliminated by 2017, respite care use remained low among both Black and white caregivers. Data are from the National Health and Aging Trends Study (NHATS) and the National Study of Caregiving (NSOC) from 2015, 2017, and 2021.
Even though there have been efforts to expand access, too many caregivers are still doing this difficult work without enough support. This highlights the persistence of structural and informational barriers to care—including financial cost, lack of awareness, cultural expectations, and insufficient supply of respite providers.
The underuse of respite care represents a missed opportunity to support the mental and physical health of caregivers, and thereby also the stability of dementia care at home.
Kim and colleagues recommend several strategies to improve access to respite care for families supporting older adults with dementia, including integrating respite services more fully into long-term care systems, particularly through expanded support in Medicaid-funded programs like home- and community-based services waivers.
Better outreach and clearer communication could also raise awareness of available services, since many caregivers remain uninformed or face fragmented information, the researchers note. There is a clear need for more flexible respite options that can accommodate the diverse cultural, financial, and scheduling needs of caregivers. For example, offering evening or weekend respite hours for those who work during the day, or providing in-home options for caregivers who are uncomfortable with facility-based care, could make a meaningful difference.
Simplifying program design, reducing waitlists, and ensuring consistent availability are also key to increasing use of these services, they said.
1. Julia G. Burgdorf et al., “Variation in Home Healthcare Use by Dementia Status Among a National Cohort of Older Adults,” The Journals of Gerontology, Series A: Biological Sciences and Medical Sciences 79, no. 3 (2024).
2. Karen Shen et al., “Paying for Home Care Out-of-Pocket Is Common and Costly Across the Income Spectrum Among Older Adults,” Health Affairs Scholar 3, no. 1 (2025).
3. Yeunkyung Kim et al., “Trend in Respite Use by Race Among Caregivers for People Living With Dementia,” The Journals of Gerontology, Series A: Biological Sciences and Medical Sciences 79, Supplement 1 (2024): S42-S49

Contributing Senior Writer

Associate Vice President, U.S. Programs
Early onset chronic disease, a growing caregiving gap, and climate change are among the major trends affecting the health and well-being of older Americans and their families, according to leading scholars from across the country.
Before a standing-room-only crowd at the 2025 meeting of the Population Association of America in Washington, D.C., experts identified seven key themes that are challenging policymakers, planners, and families as the U.S. population rapidly ages.
The United States has experienced the earliest and greatest slowdown in life expectancy improvements among higher-income countries, reported Eileen Crimmins of the University of Southern California/University of California-Los Angeles Center on Biodemography and Population Health.
“We have horrible life expectancy—and it’s getting worse and worse,” she said, pointing to the diverging line for the United States in Figure 1. Though premature deaths from heart disease and stroke have declined, Americans today are unhealthy for a longer portion of their lives, coping with chronic diseases and conditions such as diabetes, hypertension, arthritis, cancer, and heart problems.
While we “have a long way to go” to improve the health of the U.S. population, Crimmins said, new research into biomarkers gathered through blood and other medical tests is offering clues into what speeds up or slows down the aging process, including stress levels, income, and social connections over a lifetime.
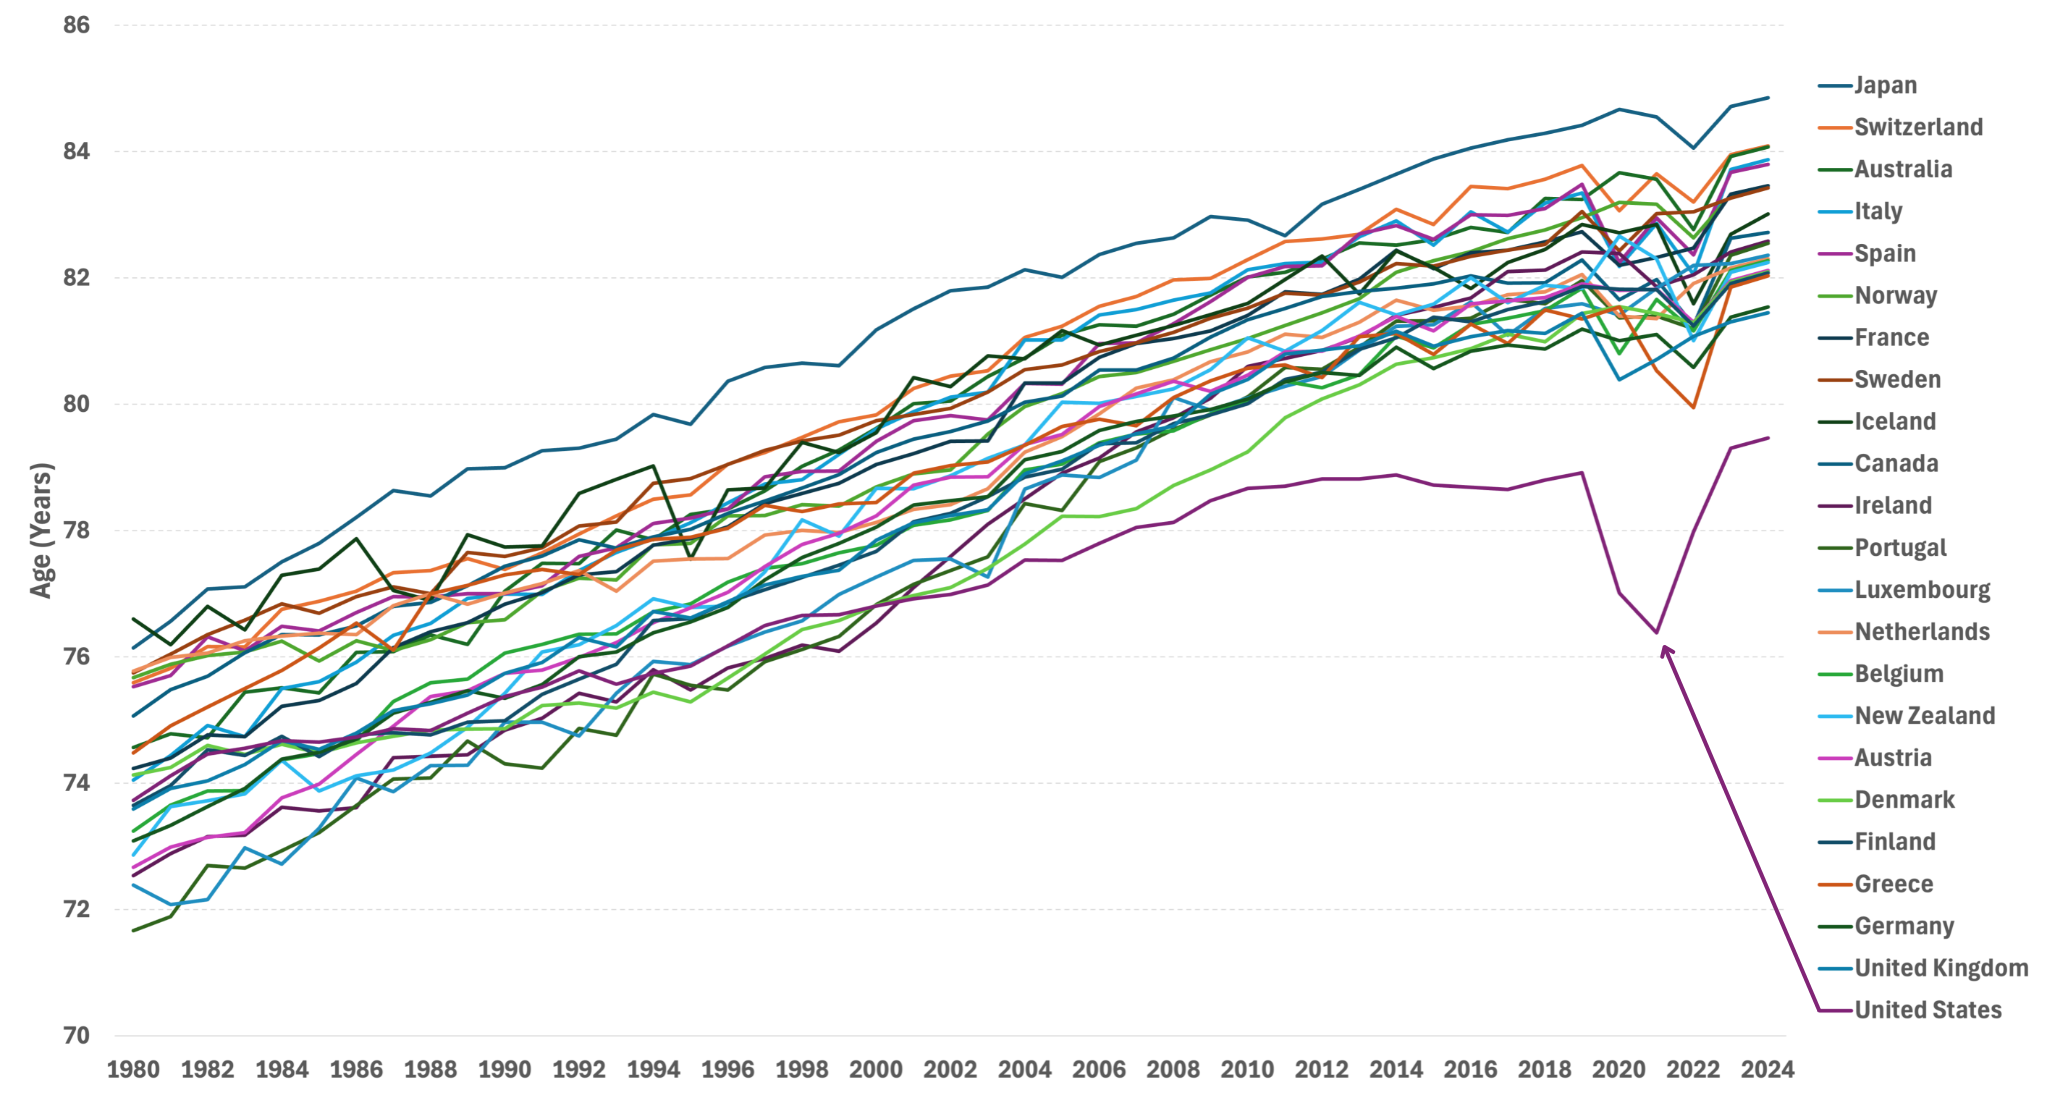
Source: United Nations, World Population Prospects.
While advances in health care have succeeded in preventing many early deaths, older people are spending more time living with chronic diseases today than two decades ago, Crimmins’ forthcoming research shows. Americans spent more years after age 65 living with diabetes, cancer, heart disease, arthritis, and high blood pressure in 2018 than in 1998, she has found.
Scott Lynch of the Duke Center for Population Health and Aging agrees. Over the past century, complex chronic conditions like cardiovascular disease and cancer have replaced infectious diseases like pneumonia and tuberculosis as the leading causes of death, he noted. In addition to biomarker research, longitudinal studies that follow individuals over decades have contributed to a growing understanding that events and conditions in childhood and adolescence shape health and lifespans in adulthood and old age, he said.
Improving the health of children and young people has profound effects later in life, argued William Dow of the Center on the Economics and Demography of Aging at the University of California, Berkeley. He pointed to new research showing that people with Medicaid insurance in childhood have better health as adults. “By reducing disability and keeping people in the labor force, Medicaid is actually paying for itself,” Dow said.
Family members provide most of the care that enables older people to live safely in their own homes, said V. Joseph Hotz of the Center for Healthy Aging Behaviors and Longitudinal Investigations at the University of Chicago. Among care recipients ages 65 and older, 69% receive only informal home care from friends and relatives, whereas just 5% receive only formal paid home care (Figure 2).
But a care gap is emerging as the baby boom generation ages. The traditional caregiver population (ages 45 to 64) is shrinking while the number of oldest-old Americans—those most likely to need care—is growing. By 2040, there are expected to be just three traditional caregivers per person ages 80 or older—down from a 6:1 ratio in 2025, according to Census Bureau projections.
But there is some good news, Hotz adds. While research finds that adult children feel less obliged to care for stepparents, new evidence suggests that an increasing share of adult children are stepping up when older parents are in need (for example, having trouble buying food). His own analysis shows that childless older people received as much help from their siblings, other relatives, and friends as their peers received from their adult children.

Source: Jonathan Gruber and Kathleen M. McGarry, “Long-term Care in the United States,” National Bureau of Economic Research, Working Paper 31881, November 2023, DOI 10.3386/w31881.
Compared with their peers who have supportive families and robust social networks, socially isolated older people face a greater risk of early death, dementia, heart disease, diabetes, and a host of other conditions, explained Debra Umberson of the Center on Aging and Population Sciences at the University of Texas at Austin. “The evidence is increasingly convincing, overwhelmingly persuasive,” she said.
Inflammation, depression, hypervigilance, alcohol consumption, and the disadvantages of lower levels of education all play a role in poorer outcomes among older adults, Umberson said. Social isolation is a modifiable risk factor; the challenge is “identifying who is most at risk, why, and what can be done.”
Research suggests that “isolation begins to increase as early as adolescence and continues steadily through the life course,” she reported. Black Americans, people living in poverty, and sexual and gender minority populations tend to experience higher levels of isolation than other groups. Experiencing the death of a family member, extreme weather events (like Hurricane Katrina, which dispersed community members), pandemics (as we saw with COVID-19), incarceration, and deportation can also disrupt families and communities.
In 2024, more than half of Americans ages 65 and older (54%) were enrolled in the Medicare Advantage program, up from just 19% in 2007. The dramatic change from a fee-for-service model to a privately run managed care model has vast implication for aging Americans, said Dan Polsky of the Johns Hopkins’ Economics of Alzheimer’s Disease and Services (HEADS) Center. Medicare Advantage plans may offer efficiency and flexibility that can lower recipients’ costs and increase access to home-based care, which most Americans say they prefer, according to Polsky. But new findings by Lauren Nicholas suggest that unpaid family caregivers may be providing more end-of-life home care for people with dementia, essentially moving costs from the formal system of payment to unpaid family members, he reported.
At the same time, traditional Medicare is not without innovations: A new program is exploring ways to meet the health care needs of both people with dementia and their caregivers, Polsky noted.
In the pipeline are new disease-modifying pharmaceutical treatments for dementia, but they require an early diagnosis, which only a fraction of people receive. Should these treatments scale, it could cost the Medicare program tens of billion dollars a year, presenting an additional challenge to the already-strained Medicare budget. Implementing new early diagnosis techniques and providing cost-effective new treatments will present complicated hurdles for the health-care delivery system, Polsky suggested.
The more than 5 million family members and friends who provide unpaid care for older adults with dementia have high—and increasing—demands on their time, reported Jennifer Wolff of the HEADS Center, based on her team’s research using nationally representative data.
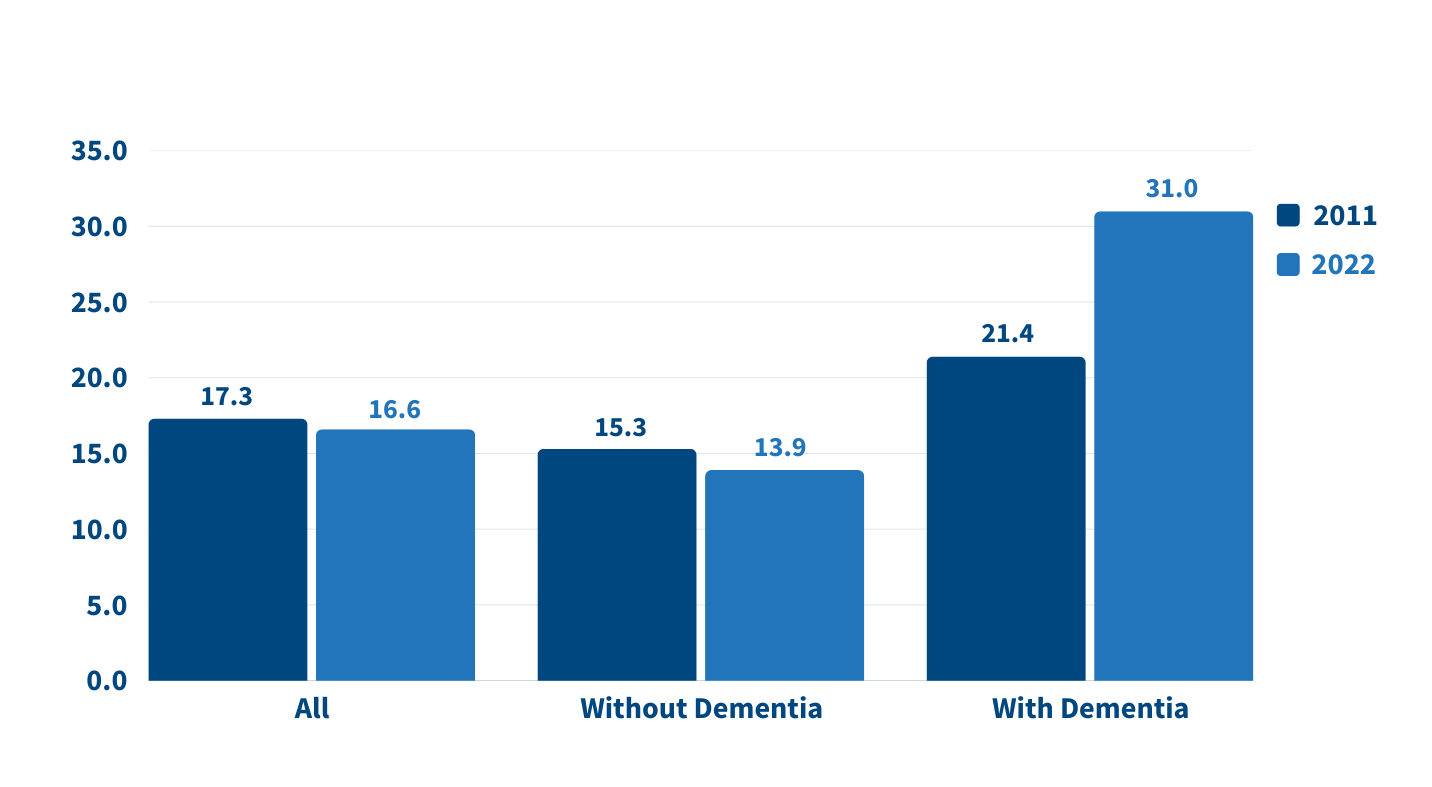
On average, the time that family caregivers spent helping older adults with dementia grew by almost 50% between 2011 and 2022, going from 21 hours per week to 31 hours (Figure 3). By contrast, time spent assisting older adults without dementia fell during the same period.
Wolff and team show that more than half (52%) of dementia caregivers lived with the person they were caring for in 2022, up from 39% in 2011. And the share able to hold jobs—outside their caregiving work—dropped from 43% to 35% during the same period.
Noting that the number of individuals affected by dementia is projected to triple in the next 30 years, Wolff underscored the importance of monitoring unpaid caregivers and developing interventions to support them. Some strategies could include providing direct financial assistance and tax relief, supporting flexible work arrangements and paid family leave, and using digital tools and remote monitoring technologies to help caregivers manage care more efficiently and connect with support networks.
Source: Jennifer L. Wolff, Jennifer C. Cornman, and Vicki A. Freedman, “The Number of Family Caregivers Helping Older US Adults Increased From 18 Million to 24 Million, 2011–22,” Health Affairs 44, no. 2 (2025): 189-95.
More devastating fires, storms, and hurricanes, along with greater climate variability are the “new normal,” said Elizabeth Frankenberg of the Carolina Population Center at the University of North Carolina at Chapel Hill.
People who experience these events not only face an increased risk of death and disease but also lost livelihoods, diminished assets, and poor quality of life for months, years, and even decades to come, she noted.
Older people can be uniquely vulnerable due to reduced physical mobility, cognitive decline, diminished temperature regulation, and changes in economic resources, access to safety net programs, and the availability of social and family networks. Further, their ability to cope with change may be influenced by anxiety around uncertainty, a deep attachment to where they live, and difficulty making life-changing decisions.
To effectively plan for, mitigate, and adapt to severe weather events and temperature changes, demographers should team up with engineers to better understand the level of vulnerability in specific risky locations, Frankenberg said. For example, older people with lower incomes and limited mobility may need emergency support in places with rising sea levels or that are prone to wildfires.
The experts noted several promising areas for future research that can improve the health and well-being of older adults, including:
The researchers emphasized that many of these priorities require sustained investment in longitudinal data collection and interdisciplinary collaboration across aging research centers.
The scholars featured above lead many of the 15 research centers on the demography and economics of aging and Alzheimer’s disease and Alzheimer’s related dementias supported by the National Institute on Aging (NIA) of the National Institutes of Health for the past 30 years.
A coordinating center based at the University of Michigan supports the dissemination of findings from the centers in partnership with PRB.


Research Associate

Research Analyst

Senior Vice President, Programs
New data released by the Appalachian Regional Commission (ARC) and PRB in the 15th annual update of The Appalachian Region: A Data Overview from the 2019-2023 American Community Survey shows that rates of labor force participation and homeownership continue to improve in Appalachia.
Drawing from the latest American Community Survey and comparable 2023 Census Population Estimates, the report, known as “The Chartbook,” contains more than 300,000 data points comparing Appalachia’s regional, subregional and state data with the rest of the nation.
Key improvements in the region’s economic indicators are as follows:
Decrease in unemployment rates and higher labor force participation
Homeownership bypasses national average
Below average number of cost burdened households
“While Appalachia continues to make progress toward reaching economic parity with the rest of the country, it’s important to recognize there is still work to be done,” said ARC Federal Co-Chair Gayle Manchin. “ARC will continue to partner on the local, state, and federal levels to prioritize the future of Appalachia’s 13 states and remains committed to ensuring Appalachians have access to the education, job training and infrastructure they need for prosperous lives in the places they love.”
“This year’s Chartbook highlights important economic advances, not only in Maryland but across the Appalachian Region—including gains in employment and homeownership,” said ARC 2025 States’ Co-Chair, Maryland Governor Wes Moore. “By working together, we continue to uplift our most vulnerable populations, promoting a better, brighter future for all families across Appalachia.”
Despite positive trends, several data points revealed key challenges affecting Appalachian economies compared to the rest of the nation:
Despite population increase, growth lags
Post-secondary educational attainment remains behind national average
Greater share of Appalachians live in poverty
“The data point to bright spots but also guide us to areas where targeted efforts could improve well-being for Appalachians across the region,” said Sara Srygley, a senior research associate at PRB. “Decisionmakers and advocates can use the Chartbook to create the changes they want to see in their communities.”
The data shows that Appalachia’s rural areas continue to be at increased risk for economic distress compared to its urban areas. Appalachia’s 107 rural counties are also more uniquely challenged, compared to 841 similarly designated rural counties across the rest of the U.S., as rural Appalachian counties continue to lag behind on indicators including educational attainment and household income.
The data also highlights key differences between Appalachia’s subregions, including:
In addition to the written report co-authored by the Population Reference Bureau, ARC offers companion web pages on Appalachia’s population, employment, education, income and poverty, computer and broadband access, and rural Appalachian counties compared to the rest of rural America’s counties. For more information, visit www.arc.gov/chartbook.
About the Appalachian Regional Commission
The Appalachian Regional Commission is an economic development entity of the federal government and 13 state governments focusing on 423 counties across the Appalachian Region. ARC’s mission is to innovate, partner, and invest to build community capacity and strengthen economic growth in Appalachia to help the region achieve socioeconomic parity with the nation.

Associate Vice President, U.S. Programs
Contributing Senior Writer
As the large Baby Boom generation enters advanced ages, more family members and other unpaid helpers are stepping in as caregivers. In just over a decade, the number of family caregivers regularly assisting older adults with daily activities at home grew by 32%, increasing from 18.2 million to 24.1 million between 2011 and 2022.1
While the caregiving cadre has grown, who’s getting care has also changed. Older Americans receiving family care are younger, better educated, and less likely to have dementia than they were in 2011, report Jennifer L. Wolff of Johns Hopkins University, independent consultant Jennifer C. Cornman, and Vicki A. Freedman of the University of Michigan.
The increase in family caregiving partly reflects the rising share of older adults with multiple chronic conditions, such as heart disease, hypertension, stroke, and cancer. And while the share of older adults with dementia has declined, unpaid caregivers average twice as many hours each week caring for people with dementia than without dementia (about 31 hours versus 14), Wolff and team found (see Figure 1).
In addition, a new study estimates that the number of new dementia cases will double over the next 40 years as the population ages—setting the stage for more demands on dementia caregivers and more changes to the caregiving landscape.
“Understanding the changing composition and experiences of family caregiving has never been more important, but it is challenging to assess,” the researchers write. “[It] requires consistent measurement for well-characterized, generalizable samples of people who receive and provide help.”
The nationally representative National Study of Caregiving and the National Health and Aging Trends Study offer important insights. The two studies provide a snapshot of the family caregivers that help Americans ages 65+ who live in the community (i.e., at home or with a relative) or in a residential care setting other than a skilled nursing facility, such as an assisted or independent living facility, a personal care home, or a continuing care retirement community.
Family caregivers include relatives and unpaid helpers, like neighbors and friends, who assist with personal care tasks like bathing and dressing; mobility tasks like getting out of bed and getting around the house; and household activities such as laundry, food preparation, shopping, and managing money.
On average, the time that family caregivers spent helping older adults with dementia increased by almost 50% over the decade, rising from 21.4 hours per week in 2011 to 31.0 hours in 2022. By contrast, time spent assisting older adults without dementia fell from 15.3 hours a week in 2011 to 13.9 hours in 2022 (Figure 1).
Source: Jennifer L. Wolff, Jennifer C. Cornman, and Vicki A. Freedman, “The Number of Family Caregivers Helping Older US Adults Increased From 18 Million to 24 Million, 2011–22,” Health Affairs 44, no. 2 (2025): 189-95.
People caring for older adults with dementia have high—and increasing—demands on their time. More than half (51.7%) of dementia caregivers lived with the person they were caring for in 2022, up from 39.4% in 2011, Wolff and team report. And the share able to hold jobs—outside their caregiving work—dropped from 42.5% to 34.6% during the same period.
Among caregivers with formal jobs, the share who reported challenges with their employment—including working fewer hours or being less productive—increased over the decade, regardless of whether they cared for someone for dementia.
“Challenges are exacerbated when caregivers are in poor health themselves; have a lack of choice in assuming the caregiving role; and, for the substantial proportion of family caregivers who are employed, work in low-wage jobs with limited flexibility,” the researchers note.
Which older Americans get family care? As in the past, they tend to be female, non-Hispanic white women who are married or widowed. But growing numbers of family care recipients are male and have some college education. More are also separated and divorced compared to 2011, reflecting national trends.
Who’s providing care? Family caregivers continue to be largely female and married, and most report being in good health. In 2022, adult children still made up the largest share of family caregivers for older adults, at 40.7%, but this represents a significant decline since 2011 (Figure 2).
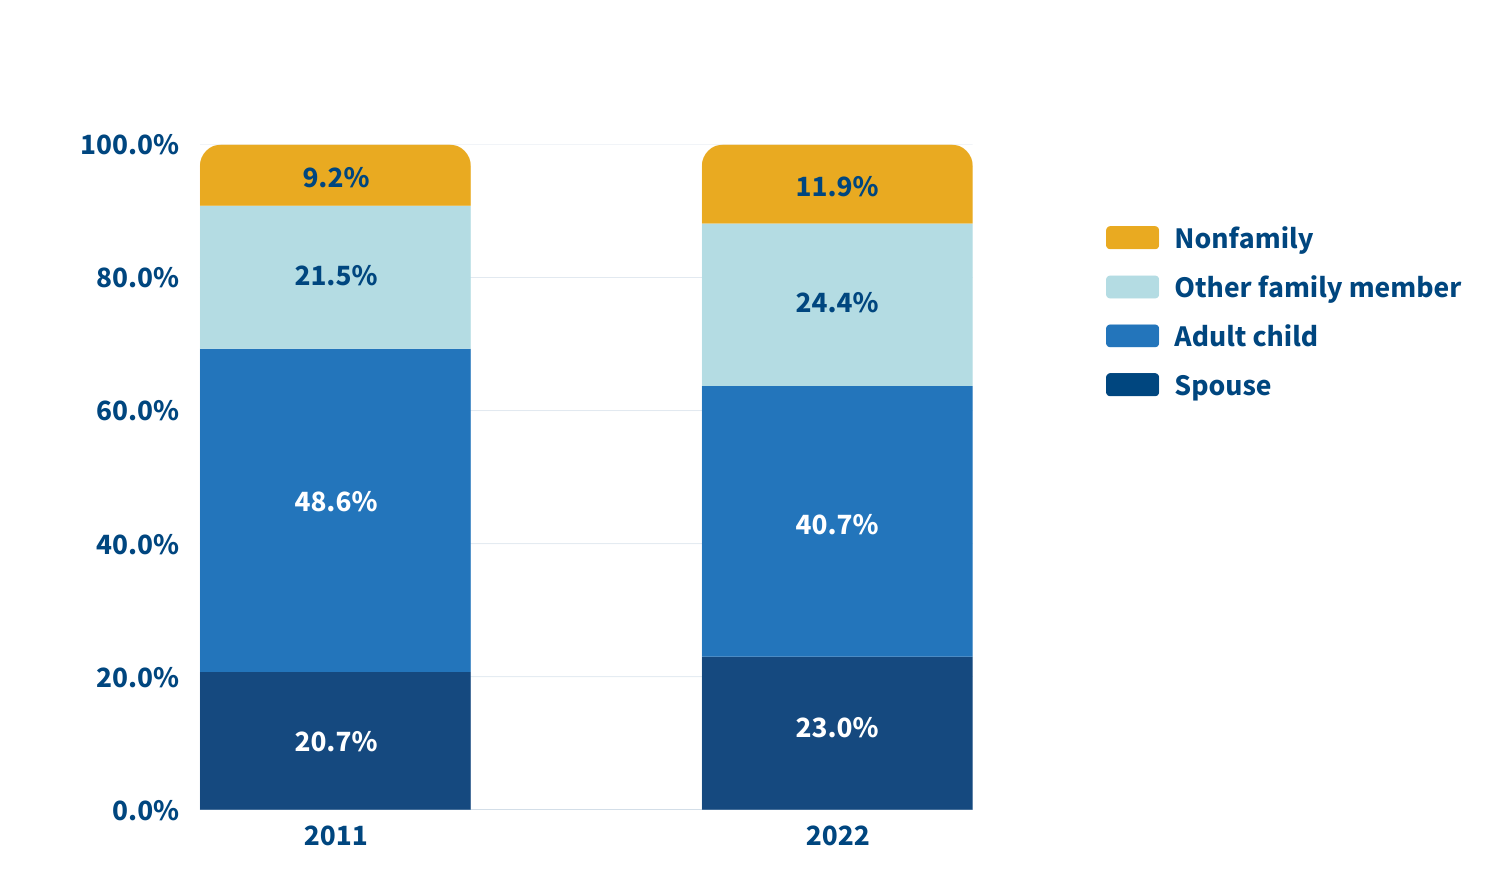
Source: Jennifer L. Wolff, Jennifer C. Cornman, and Vicki A. Freedman, “The Number of Family Caregivers Helping Older US Adults Increased From 18 Million to 24 Million, 2011–22,” Health Affairs 44, no. 2 (2025): 189-95.
In 2022, adult children accounted for about half (49.1%) of family caregivers for older adults with dementia, compared with 38.4% of caregivers for those without dementia. Just 17.7% of family caregivers for older adults with dementia were spouses, compared with 24.5% of family caregivers for people without dementia.
A sizeable share of family caregivers (17.0%) had children under age 18 at home in 2022, and 6% to 13% viewed their care responsibilities for older adults as a source of financial, physical, or emotional difficulty.
Despite these challenges, the researchers report a decline in the use of support groups (4.1% to 2.5%) and respite services (12.9% to 9.3%) between 2011 and 2022.
Many caregivers face extraordinary demands and should be the focus of support services, Wolff and colleagues say. They single out those caring for older adults with dementia or nearing the end of life, as well as caregivers “from racial and ethnic minority groups who are more likely to assist people who have extensive care needs in circumstances that involve scare economic resources.”
Family care needs are likely to rise as the number of U.S. adults ages 85 and older is projected to triple by 2050. The researchers note that the number of family caregivers rose even as the long-term use of skilled nursing facilities among older Americans dropped and community living increased. The challenges these caregivers continue to face is “sobering,” they write, including competing time demands from work and child care while spending an average of 17 hours per week on care. In addition, about 1 in 8 family caregivers report financial, physical, or emotional difficulties related to their caregiving roles, percentages that were largely unchanged over the 11 years examined.
Policies and programs to help reduce the financial, physical, and emotional burden of caregiving exist, but do not represent a coherent strategy, the researchers say. “Local, state, and federal policies are a patchwork that is uneven in availability and largely symbolic in magnitude,” they argue. Addressing the needs of family caregivers will require a “cohesive framework in support of the care economy.”
1. Jennifer L. Wolff, Jennifer C. Cornman, and Vicki A. Freedman, “The Number of Family Caregivers Helping Older US Adults Increased From 18 Million to 24 Million, 2011–22,” Health Affairs 44, no. 2 (2025): 189-95.


Contributing Senior Writer
Associate Vice President, U.S. Programs
Senior Vice President, Programs
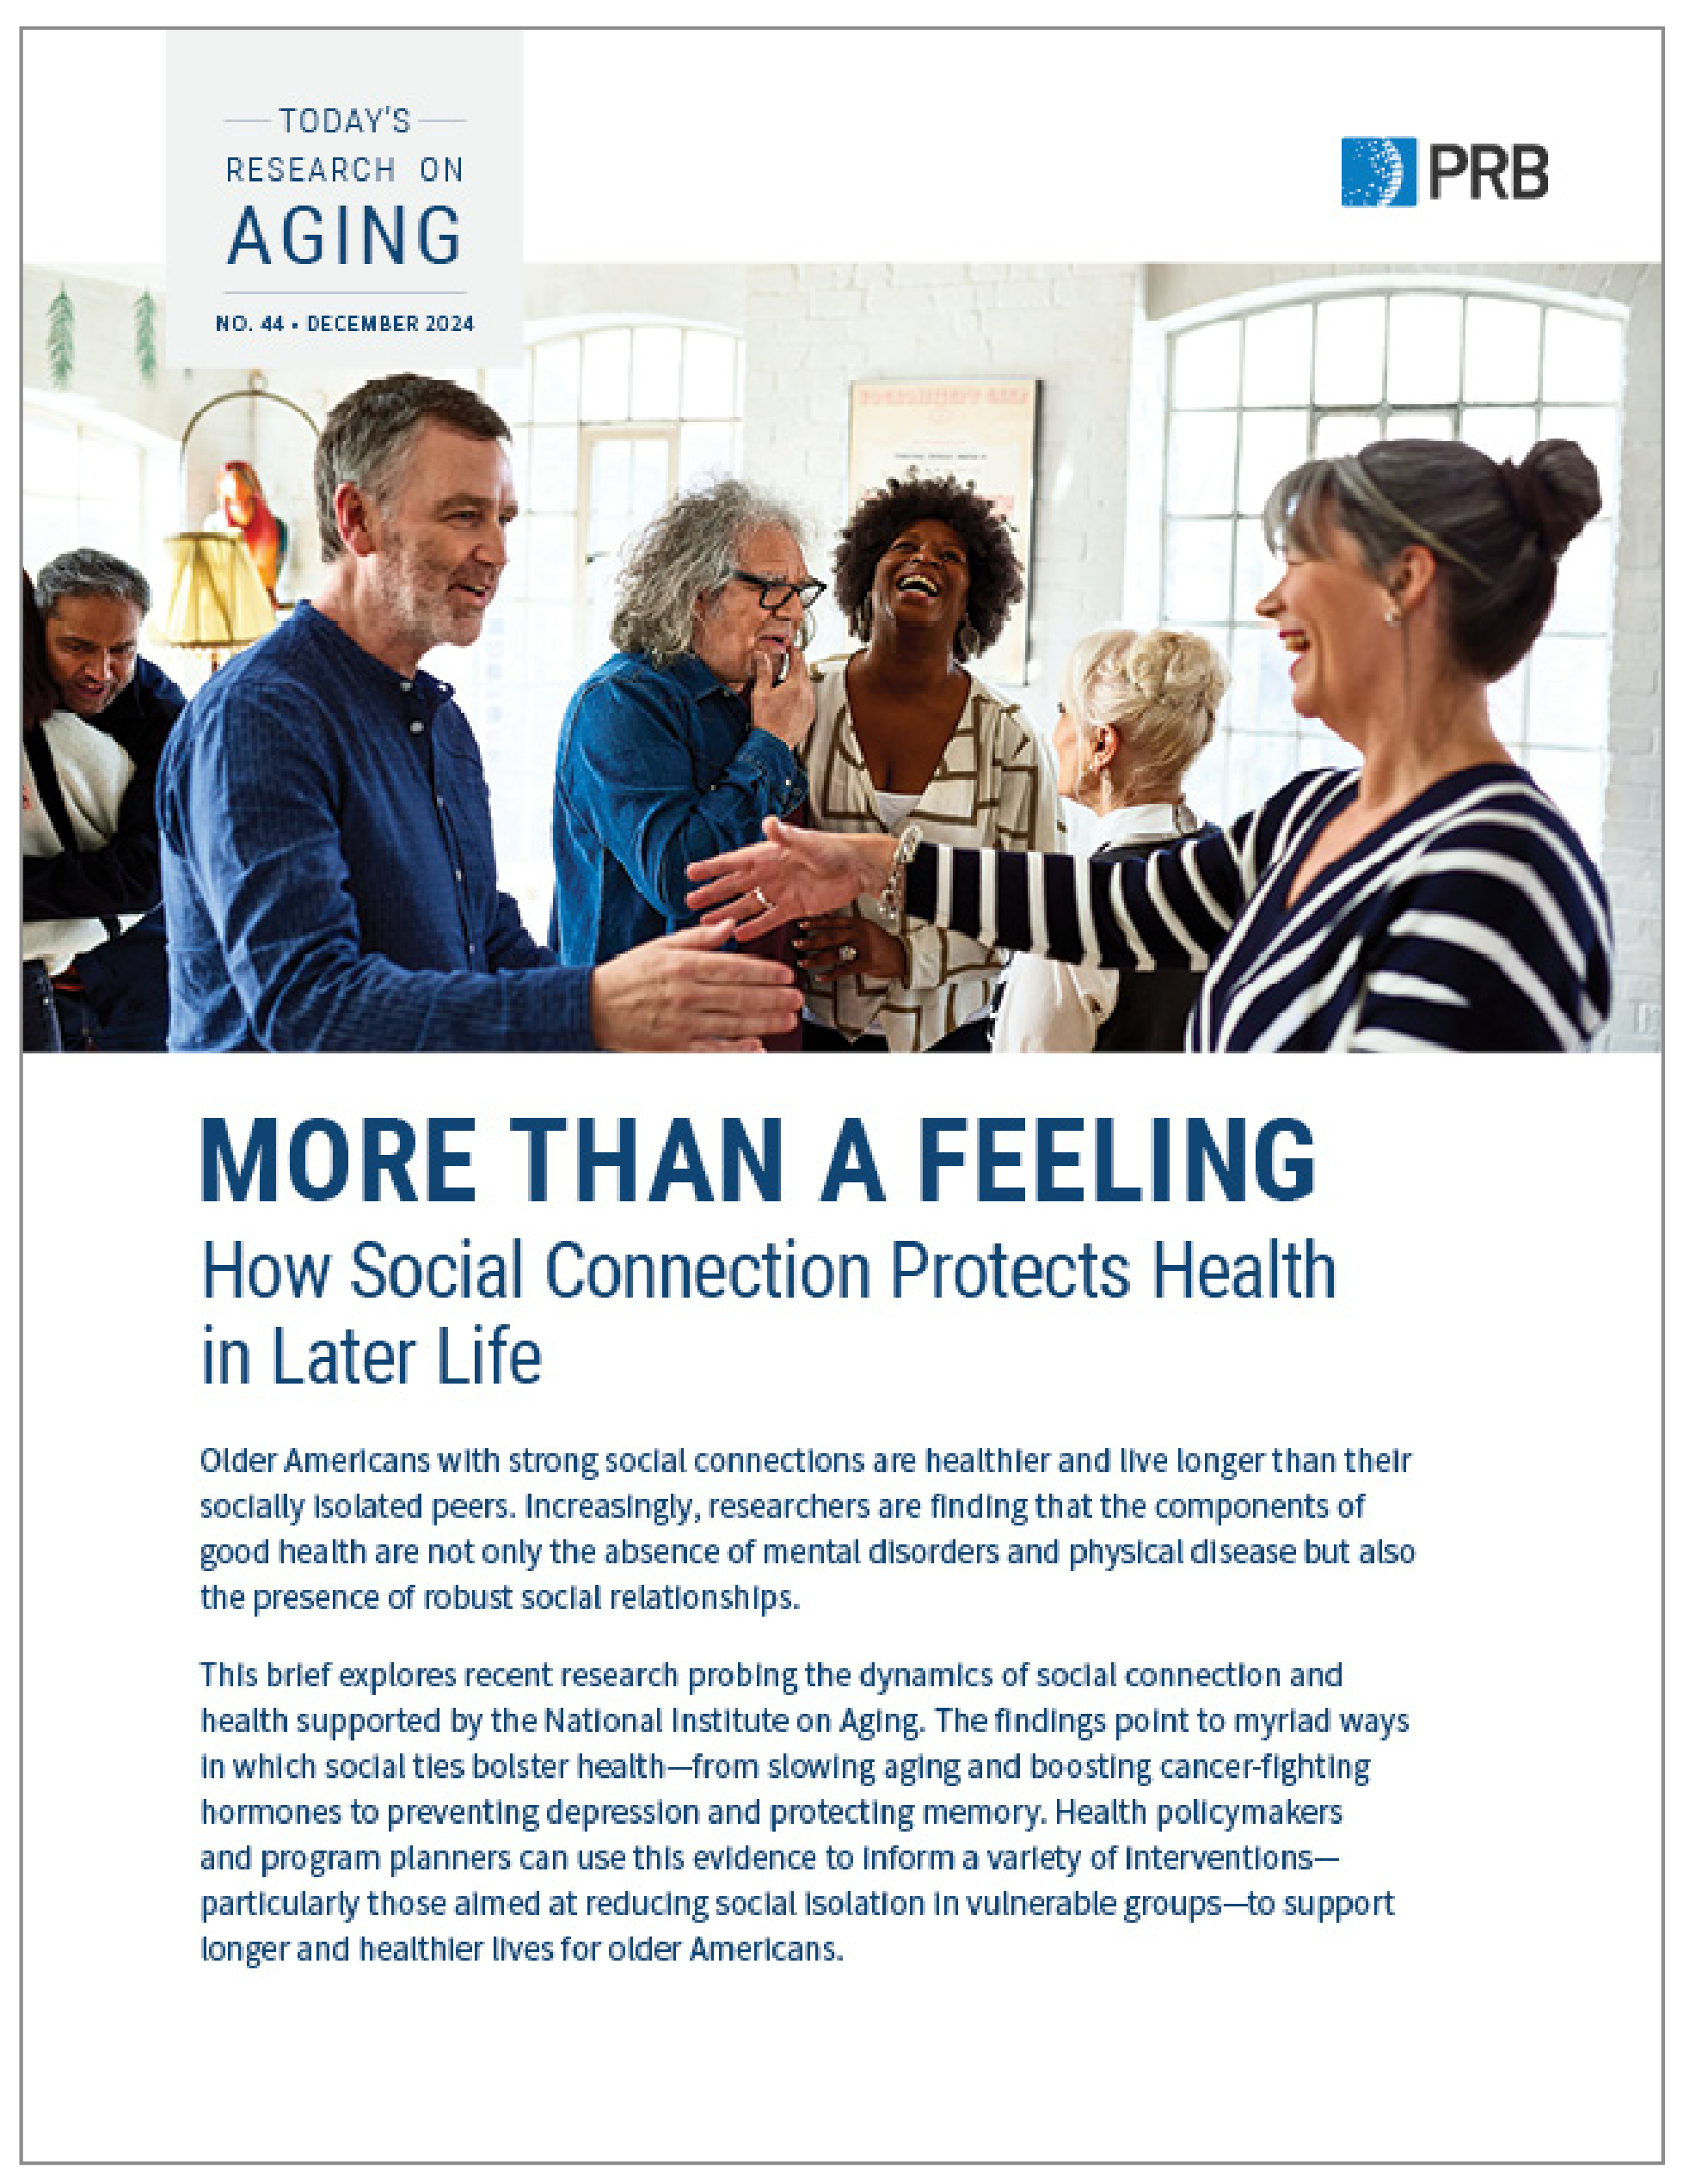
This brief explores recent research probing the dynamics of social connection and health supported by the National Institute on Aging. The findings point to myriad ways in which social ties bolster health—from slowing aging and boosting cancer-fighting hormones to preventing depression and protecting memory. Health policymakers and program planners can use this evidence to inform a variety of interventions—particularly those aimed at reducing social isolation in vulnerable groups—to support longer and healthier lives for older Americans.
Studies have shown that both the quality and quantity of our social ties shape our mental and physical health, health behaviors, and mortality risk. Researchers are studying multiple aspects of our social lives—from the levels of social support we receive to our activities and the strength of our social networks—to understand how they link to health outcomes.
Healthy, supportive relationships with family and friends may slow aging, concluded a research team from the University of California, Los Angeles (UCLA) and the University of Southern California (USC).1 According to their DNA, older adults with the most supportive relationships with spouses, adult children, other family members, and friends were aging one to two years slower than those who lacked such ties, they found. The pace of such aging is important—rapid epigenetic aging at younger chronological ages can contribute to the early onset of chronic disease and disability and premature death.

The healthiest older adults had strong social connections and just a 4% risk of dying within five years.
More new research poses that social connections may also improve the well-being of cancer patients by boosting protective hormones.
A research team from six major universities found that in ovarian cancer patients, social support was associated with higher levels of oxytocin—a hormone linked to some protection against cancer.3 Specifically, having a more positive outlook, a sense of purpose, and a role in caring for others at the time of cancer surgery were associated with higher oxytocin levels. (However, a person’s perceived closeness with others was not related to higher oxytocin levels.)
“Nurturance is consistent with the oxytocin-focused ‘tend and befriend’ hypothesis of female coping and stress response,” wrote the team, led by Michaela G. Cuneo at the University of Iowa. Thus, even though this research is in the early stages, feeling needed by others could have protective health effects for women with ovarian cancer.
Similarly, another team of researchers at the National Cancer Institute and the University of Wisconsin–Madison found that strong, supportive relationships between cancer patients and their caregivers were associated with better self-reported health for both parties.4 This was especially the case for those dealing with lung cancer, where social support was linked to better self-reported health 12 months after diagnosis. Dannielle E. Kelley and coauthors speculate that there may be a beneficial “partner effect” for lung cancer that can counter internalized and social stigmas associated with the disease for former smokers.

Strong, supportive relationships between cancer patients and their caregivers were associated with better self-reported health for both parties.
Some groups of people are more likely to be socially isolated than others, report Debra Umberson of the University of Texas at Austin and Rachel Donnelly of Vanderbilt University.9 Older married women may become socially isolated when a spouse needs round-the-clock care, while men who either never marry or divorce may begin experiencing social isolation in young adulthood.
In addition, non-Hispanic Black and Hispanic older adults are more likely to experience social isolation than non-Hispanic older white adults, they found (see Figure 1). Black and Hispanic Americans’ social isolation could be related to the impact of lifetime discrimination and financial stress, the researchers suggest. Using HRS data, the study measured isolation among adults ages 50 and older based on whether they are married or cohabiting, participate in volunteer activities, and have contact with parents, children, and neighbors.
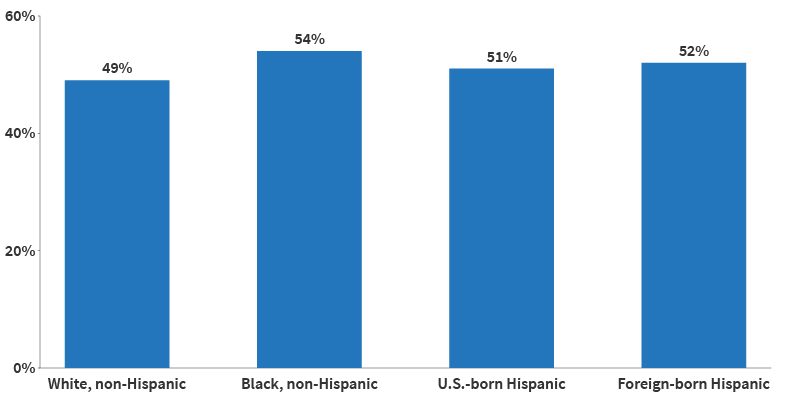
Source: Debra Umberson and Rachel Donnelly, “Social Isolation: An Unequally Distributed Health Hazard,” Annual Review of Sociology 49, no. 1 (2023): 379-99.
Another study out of Johns Hopkins University estimated that nearly one in four (24%) of older Americans living in the community are socially isolated, and one in 25 (4%) are severely isolated.10 To measure isolation, they examined participants’ living arrangements, religious attendance, social activities, and the number of people they spoke with about important matters. The study used data from the National Health and Aging Trends Study, which includes a nationally representative sample of Medicare beneficiaries ages 65 and older.
Being unmarried, male, and having low education and income levels increased the odds of being socially isolated, according to the analysis, led by Thomas Cudjoe. Specifically, men were four times as likely as women to be severely isolated, while people with annual incomes below $30,000 were twice as likely as people with incomes over $60,000 to be severely isolated. These findings offer “easily identifiable” factors to help program planners target those most at risk, the researchers wrote, noting that living arrangements, discussion networks, and social activities can all be modified to improve social connections.
Calling social isolation “an unequally distributed health hazard,” Umberson and Donnelly urge future researchers to undertake “a systematic assessment of social conditions that foster isolation over the life course” to better understand the root causes and identify ways to reduce isolation among those most at risk.
Older adults’ social networks may protect both their mental health and cognitive abilities. Getting help with daily activities may be an important reason why—since many older adults need assistance bathing, getting in and out of bed, and doing other tasks, some built-in social interaction can accompany aging. But feelings of closeness and companionship may also help stave off memory loss, loneliness, and depression—and may matter as much or more than geographic proximity or number of family or friends, new research shows.
To try to understand the importance of relationship quality, Sarah Patterson of the University of Michigan and Rachel Margolis of the University of Western Ontario looked at four groups of older adults with different types of family connections: those who were geographically and emotionally close with family; those who were kinless and without a partner or children; those who were distanced and lived far from family; and those who were disconnected and had no family members in their social network or did not know where they lived.14
The closeness of the relationships—especially with family—buffered loneliness.
“We were interested in understanding how much the presence of family ties matters for older adults’ well-being but also in measuring the quality of those relationship ties,” said Patterson.15
They found that older adults who lived near family members and discussed important concerns with them were less likely to report unmet need for help with daily activities than the other groups (see Figure 2). Meanwhile, those who reported no partner or family or disconnection had the poorest mental health and socialized less often—even less than those who lived far away from their family.
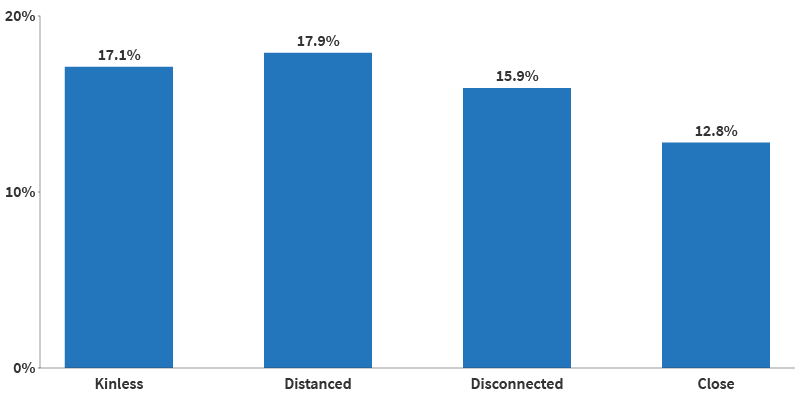
Source: Sarah E Patterson and Rachel Margolis, “Family Ties and Older Adult Well-Being: Incorporating Social Networks and Proximity,” The Journals of Gerontology: Series B, Volume 78, no. 12 (December 2023): 2080–89.
The findings suggest that the presence and strength of family ties matter for older adults’ mental health. “As families continue to evolve, researchers should strive to capture the size and shape of family networks, as well as the level of connection that older adults have with those kin,” the authors note.
In fact, social connections can also produce distress. Stephanie T. Child and Leora E. Lawton of UC Berkeley found that social companionship and emergency help mattered most to older adults, whereas having more people from whom they sought advice was related to more psychological distress.16 The findings suggest that mental well-being may be enhanced by enjoyable and helpful relationships, while those that are more demanding may detract from it. Data are from the UC Berkeley Social Networks Study (UCNets), which includes a locally representative sample from across the San Francisco Bay Area in California.
Several recent studies build on the well-established link between marriage and better physical and psychological health in old age, particularly for men. They examine some of the ways marriage may benefit health as well as the connections between marriage and other forms of social interaction.
New research finds that marriage can help men be less socially isolated throughout their lives. Umberson of University of Texas at Austin, Zhiyong Lin of University of Texas at San Antonio, and Hyungmin Cha of USC show that men tend to be more isolated in adolescence and young adulthood, while women tend to experience isolation in later life.19 Their analysis of HRS data shows that levels of social isolation increase with age for both men and women.
But gender patterns differ by marital history (see Figure 3). Among older adults in stable marriages, women are less isolated than men until age 60, but by age 68, men are slightly less isolated than women. This gender gap shrinks at older ages for those who have experienced marital disruptions, possibly because chronic health issues contribute more to social isolation among women, the authors note.
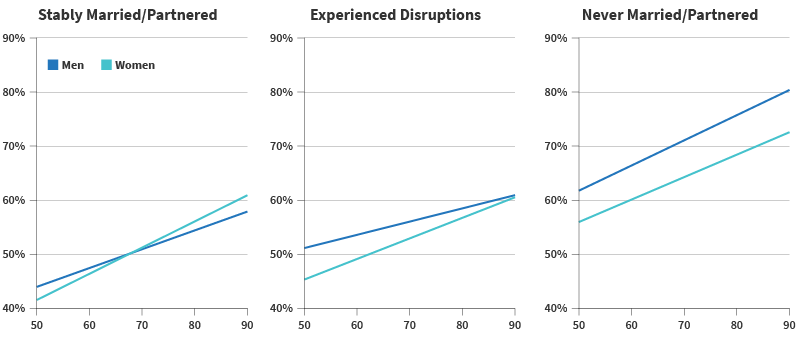
Source: Debra Umberson, Zhiyong Lin, and Hyungmin Cha, “Gender and Social Isolation Across the Life Course,” Journal of Health and Social Behavior 63, no. 3 (2022): 319-35.
There may be an unexpected physiological explanation for some of marriage’s health benefits. Drawing on lessons from primate research and using stool samples from a subset of participants in the long-running Wisconsin Longitudinal Study, researchers affiliated with the University of Wisconsin-Madison find that spouses in self-described close marriages tend to have more diverse and healthful gut microbiota compared with siblings, people without a partner, or married couples in less close relationships.20 Less diverse gut microbiota is related to obesity, cardiac disease, type 2 diabetes, and other inflammatory disorders, Kimberly Dill-McFarland and coauthors note.
Not all marriages are equal when it comes to social support and its potential health effects. Both men and women in same-sex marriages are more likely than those in different-sex marriages to offer concrete support to a spouse in distress, such as taking over chores or giving extra personal time, found Mieke Thomeer of the University of Alabama at Birmingham, Amanda Pollitt of Northern Arizona University, and Umberson.21 The team used a survey of 378 midlife couples ages 35 to 65.

Among older adults in stable marriages, men are less isolated than women.
Multiple studies have shown that a neighborhood’s physical features—from broken sidewalks and high crime to plentiful parks and low air pollution—are related to older residents’ health and quality of life.25 Not surprisingly, the places older people call home also shape their social connections, thereby influencing both their physical and mental health.
Neighborhood social ties may promote sensory health, a study using NSHAP data shows. Older adults who have more social connections in their neighborhoods report better self-rated vision than those who have fewer connections, find Alyssa Goldman of Boston College and Jayant Pinto of the University of Chicago.26 More social ties may lead to more time spent engaging with people and places outside of the home, protecting visual abilities, the researchers suggest. Good vision is key to older adults’ ability to safely navigate their environment, they add.
For caregivers, social support can counteract the negative effects of living in less-connected neighborhoods. Researchers at the University of California, Davis and the University of Michigan show that neighborhoods with low social cohesion—lacking a sense of community and trust among neighbors—can take a toll on mental health in the absence of social support.27 This is particularly true for dementia caregivers, who face a high risk of depression related to the emotional and physical burden of their work. But dementia caregivers living in neighborhoods with low social cohesion had fewer symptoms of depression if they had family and friends to talk to and help with daily tasks, Oanh Meyer and team found.

Local opportunities for social connection may strengthen social ties.
Phone calls and Zoom or FaceTime gatherings replaced in-person get-togethers for many people during the COVID-19 pandemic shutdowns, but a growing body of research suggests virtual interaction cannot fully replace face-to-face contact. Two recent studies, one led by Namkee Choi at the University of Texas at Austin and the other by Louise Hawkley at NORC at the University of Chicago, show that older adults who had less in-person time with family and friends and more phone calls during the first year of the pandemic were more likely to experience loneliness.32

Phone calls are an important source of social connection for older adults with impaired vision or hearing.
As many as one in four older Americans are socially isolated and face an increased risk of poor health and early death. The research documented in this report underscores the links between strong social ties and longer, healthier lives. U.S. Surgeon General Vivek H. Murthy has called for making social connectedness a national priority, “the same way we have prioritized other critical public health issues such as tobacco, obesity, and substance use disorders.”36 His recent advisory, Our Epidemic of Loneliness and Isolation, identifies multiple actions based on growing research evidence, including:
Social Isolation and Loneliness Among Older Adults: Opportunities for the Health Care System, a recent report from the National Academies of Sciences, Engineering, and Medicine, details ways health care organizations can address social isolation among older people by better educating their staff to intervene and aligning with other community agencies. Specific recommendations include:
“Our relationships are a source of healing and well-being hiding in plain sight,” Murthy said, “one that can help us live healthier, more fulfilled, and more productive lives.”37

Accessible public transportation can help improve older adults’ health by connecting them to both medial care and social activities.

With current data on more than 200 countries and territories, PRB’s World Population Data Sheet offers essential context for journalists reporting on policy, public services, health, climate, and other critical issues shaped by population shifts. The Data Sheet provides a comprehensive view of where and how populations live, projecting trends in growth, decline, and factors affecting population change. Each year’s special focus takes an in-depth look at a topic like climate adaptation so we can better understand what the data show and why it matters. PRB provides media resources that guide journalists on how to report on these complex topics for their communities.
This media brief on primary health care (PHC), a special focus of the 2024 World Population Data Sheet, identifies the components, actors, and systems of this holistic step toward universal health coverage. It includes definitions and highlights data that can be used to report stories about how PHC touches every part of our society.

With current data on more than 200 countries and territories, PRB’s World Population Data Sheet offers essential context for journalists reporting on policy, public services, health, climate, and other critical issues shaped by population shifts. The Data Sheet provides a comprehensive view of where and how populations live, projecting trends in growth, decline, and factors affecting population change. Each year’s special focus takes an in-depth look at a topic like climate adaptation so we can better understand what the data show and why it matters. PRB provides media resources that guide journalists on how to report on these complex topics for their communities.
Two media briefs explore climate adaptation and resilience, a special focus of the 2023 World Population Data Sheet. They demystify key concepts and provide journalists with causes, consequences, and examples of this issue.