2007 U.S. Population Data Sheet
Date
June 14, 2007
Author
2007 U.S. Population Data Sheet Reveals Newest Labor Force Estimates and a Profile of Scientists and Engineers
(June 2007) There are 7.4 million people in the U.S. science and engineering (S&E) labor force, according to the latest census figures. The metro areas with the largest number of people in their S&E labor force are New York-Northern New Jersey-Long Island, NY-NJ-PA (457,880); Washington-Arlington-Alexandria, DC-VA-MD-WV (310,035); Los Angeles-Long Beach-Santa Ana, CA (296,065); and Chicago-Naperville-Joliet, IL-IN-WI (236,005).
“Science and engineering employment accounts for a relatively small proportion of the U.S. labor force, but is important as an engine for higher earnings, innovation, and economic growth,” says Mark Mather, the data sheet’s author and deputy director of domestic programs at the Population Reference Bureau.
The findings are based on new estimates in PRB’s just-released 2007 U.S. Population Data Sheet, which presents labor force data for all 50 states and the top 50 metropolitan areas. Data used were from the 2005 American Community Survey.
Among 22 variables covered, key data include:
- Median earnings in the science & engineering labor force.
- Percent of the S&E labor force that is foreign-born.
- Number of persons in the S&E labor force.
- Retention of college graduates.
- Percent of persons ages 25 to 34 who are high school dropouts.
- Percent of persons ages 25 to 34 with a bachelor’s degree or higher.
- Percent of workers whose commuting time exceeds 45 minutes.
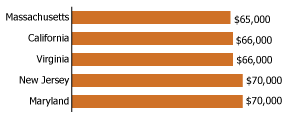
States’ ability to attract a high percentage of science and engineering workers can affect whether they flourish or decline in the economic marketplace. States and major metro areas with highly skilled workforces operate at a competitive advantage. Skilled workers earn bigger paychecks and, by extension, generate more tax revenue compared with unskilled workers. In 2005, the median annual earnings for people in S&E occupations were $58,760, compared with $27,299 for people in all occupations nationwide.
Figure 1
Median Earnings in the Science & Engineering Workforce, Top Five States, 2005

Source for ranking: Population Reference Bureau, 2007 U.S. Population Data Sheet.
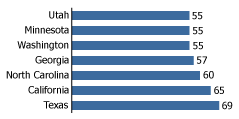
Figure 2
Percent of College Graduates Who Reside in State of Birth

Note: Retention of college graduates refers to the share of U.S.-born college graduates who are residing in their state of birth.
Source for ranking: Population Reference Bureau, 2007 U.S. Population Data Sheet.
This project was funded by the Alfred P. Sloan Foundation.

 ">
">