Child Poverty Remains High for Rural and Small-Town America
(July 2003) Despite the recession, poverty rates for families with children under age 18 have held steady overall, according to the latest annual report from the federal government America’s Children: Key National Indicators of Well-Being 2003. Child poverty rates fell during the 1990s, and education, crime, and health indicators (with the exception of overweight children) showed improvements during the last decade.
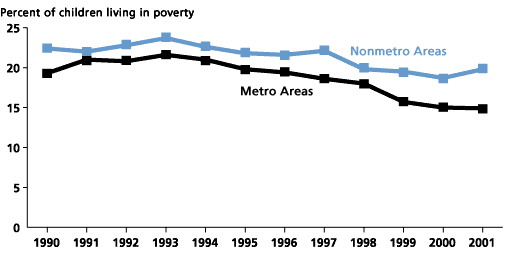
But this national trend masks significant geographic differences. For children in metropolitan areas — the big cities and suburbs — the child poverty rate held steady, at about 15 percent. For the 12.3 million children who live in small towns and rural areas, the poverty rate rose slightly, from 18.7 percent to 19.8 percent.
These figures, based on an analysis by the Rural Families Data Center of the Population Reference Bureau, use the same definitions and sources of data as the report America’s Children. The data compare family incomes reported in March 2002 with incomes reported in March 2001, so they show the effects of the early stages of the current recession.
The gap between metropolitan and nonmetropolitan incomes is seen throughout the income distribution, not just below the poverty line. For example, the proportion of children living in low-income families (those with incomes below 200 percent of the federal poverty line) is higher as well for small-town and rural children: 46.9 percent, compared with 35.7 percent for children in the larger cities and suburbs.
Family incomes are linked to the education of family members. In recent decades, only workers with college degrees have enjoyed significant increases in wages. In the nation’s metropolitan areas, nearly a third of people ages 25 to 29 have college degrees. But in nonmetropolitan areas, fewer than one in five people in this age range have completed college degrees. This proportion has been growing, but not fast enough to close the gap with the metropolitan areas.
Rural poverty is sometimes considered less severe because costs of living are lower in rural areas. A panel of the National Academy of Sciences in 1996 recommended sweeping changes in the official measure of poverty, one of which was to adjust the poverty threshold to account for regional differences in the cost of housing, an important item in the budgets of low-income families. This change would have reversed the differential in child poverty rates between metropolitan and nonmetropolitan areas, according to a U.S. Dept. of Agriculture study that used 1993 data. But the gap in child poverty rates between metropolitan and nonmetropolitan areas has widened since then, from 2 percentage points a decade ago to 4 percentage points (see figure). And while housing costs are typically lower in rural areas, some other essentials, like transportation, are often more costly for the rural poor.
Child Poverty Rates in U.S. Metro and Nonmetro Areas, 1990–2001

Source: PRB analysis of data from the Current Population Survey (March Supplement), 1991-2002.
Both the federal report and the PRB study use the definitions of metropolitan areas that were in force when the income data were collected, not the June 2003 revisions.
For additional data on child well-being in metropolitan and nonmetropolitan areas, see table below.
Economic and Education Indicators for Families with Children — Inside and Outside the Metropolitan Areas
| Year | U.S. Total | Metro | Nonmetro | |
|---|---|---|---|---|
| Percent related children below poverty | 2001 | 15.8 | 14.9 | 19.8 |
| Percent related children 18 or younger in extreme poverty | 2001 | 6.7 | 6.3 | 8.3 |
| Percent related children 18 or younger in poverty | 2001 | 9.1 | 8.6 | 11.5 |
| Percent related children 18 or younger low income | 2001 | 21.9 | 20.8 | 27.0 |
| Percent related children 18 or younger med income | 2001 | 33.2 | 32.6 | 35.8 |
| Percent related children 18 or younger high income | 2001 | 29.2 | 31.7 | 17.4 |
| Percent 18 or younger living with parents with at least one parent employed full time year round | 2001 | 78.6 | 79.2 | 76.1 |
| Percent 18 or younger in households reporting child hunger due to food insecurity | 2001 | 0.6 | 0.7 | 0.2 |
| Percent 18 or younger covered by health insurance | 2001 | 88.3 | 88.3 | 88.3 |
| Percent 16 to 19 years of age who are neither in school nor working | 2002 | 8.8 | 8.7 | 9.5 |
| Percent HS grads age 25 to 29 years of age who have completed a B.A. or higher | 2002 | 29.3 | 31.6 | 17.5 |
Note: Indicators are a subset of those published by the Federal Forum on Child and Family Statistics, America’s Children: Key Indicators of Well-Being 2003.
Source: PRB analysis of data from the Current Population Survey.
