Mark Mather
Associate Vice President, U.S. Programs

This is part of a series of PRB articles about the science and engineering workforce in the United States, funded by the Alfred P. Sloan Foundation. Additional state-level data on the S&E labor force will be available this spring, in PRB’s 2007 U.S. Population Data Sheet. Data for this article are based on the Population Reference Bureau’s analysis of the U.S. Census Bureau’s Current Population Survey and 2005 American Community Survey.
(March 2007) The increase in women’s participation in the U.S. labor force is one of the most important social, economic, and cultural trends of the past century. The growing proportion of women doing paid work has transformed gender relations, changed patterns of marriage and childbearing, and is often viewed as a key indicator of women’s progress toward gender equality in the labor force.1
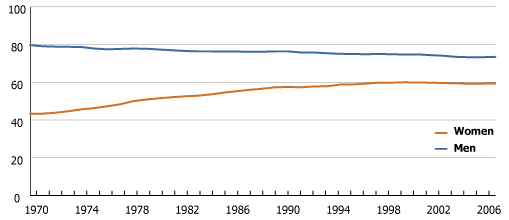
Since 1970, the proportion of all women in the labor force has increased from 43 percent to nearly 60 percent, while the proportion of men in the labor force decreased slightly, from 80 percent to 74 percent (see Figure 1).2
Figure 1
Labor Force Participation Rates for Men and Women, 1970 to 2006

Source: Current Population Survey.
This convergence between men’s and women’s labor force participation rates represents the tail end of a trend that began at least 100 years ago.
However, women’s labor force participation rates have leveled off since 1990. The reasons for this are not well understood, but researchers have pointed to several possible explanations. It may be that unprecedented economic growth during the 1990s raised men’s incomes to the point that some married women opted out of the labor force.3 The increase in men’s wages could explain trends during the 1990s, but it does not explain why women’s labor force participation rates continued to stall during the recession years since 2000.
Furthermore, some argue that the slowing economy since 2000 has had a negative impact on female labor force participation rates, by curtailing women’s access to jobs. It is not a question of women choosing to work, but rather the “weak labor demand” that has kept women from joining the labor force in greater numbers.4
Another possibility is that women’s ability to balance work responsibilities inside and outside of the home may finally have reached a limit. As women’s labor force participation rates have increased, the time available for raising children and doing household chores has been compressed, creating stress for families and particularly for working mothers.5 Some observers believe that an increasing proportion of women are choosing to stay at home to avoid this work-family conflict.6
Female labor force participation rates may have reached their limit, given the mix of economics and public policies in the United States.
Evidence from other developed countries suggests that the U.S. rate could move higher under the right mix of work-family policies. For example, generous parental leave and child care benefits have helped push Sweden’s female labor force participation rate above those in other developed countries.
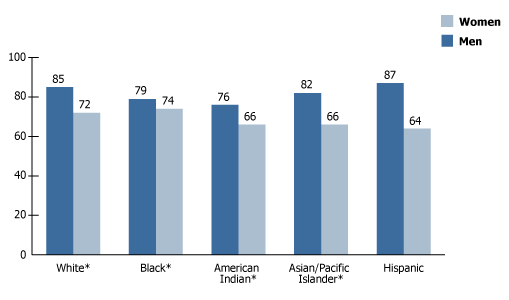
Another, often overlooked, factor affecting women’s labor force participation is the shifting racial and ethnic composition of the U.S. population. In 2005, the gender gap in labor force participation rates among working-age people—those age 20 to 64—was largest among the two fastest-growing minority groups, Asians and Latinos (see Figure 2).
Figure 2
Labor Force Participation Rates for the Population Ages 20-64, 2005

Note: * Non-Hispanic.
Source: Population Reference Bureau analysis of the 2005 American Community Survey PUMS.
Nationwide, about 87 percent of working-age Hispanic men were in the labor force, compared with 64 percent of Hispanic women. By contrast, black working-age women participated in the labor force at nearly the same rate as black men (74 percent and 79 percent, respectively).
In part, these racial/ethnic differences reflect the work patterns of new immigrants and their families. A recent study of unauthorized migrants in California showed that 94 percent of unauthorized men ages 18 to 64 were working, compared with 58 percent of unauthorized women, many of whom were caring for young children. Among legal immigrants, men also had higher labor force participation rates, although the gender differences were not as large.7
The changing racial and ethnic composition of the U.S. population and the influx of new immigrants could affect the gender gap in employment in coming decades. In 2005, immigrants accounted for 15 percent of the total labor force. By 2030, if current trends continue, immigrants will account for one-third to one-half of labor force growth.8 Since 1990, however, the increase in racial and ethnic minorities has had minimal impact on the gender gap in labor force participation rates. If the U.S. racial and ethnic composition had not changed since 1990, the 2005 labor force participation rates for men and women would increase by only 1 percentage point each.9
Racial and ethnic populations have had a big impact on labor force patterns in individual states. There are wide gender gaps in several states with large Hispanic populations, including Arizona, California, Nevada, Oklahoma, and Texas (see Figure 3, PDF: 44KB). Utah has the largest gender gap (nearly 20 percentage points), but this reflects higher-than-average labor force participation rates among working-age men (89 percent), rather than low rates among women.
There also is a cluster of states, mostly along the U.S.-Canada border, where the gender gap is relatively small (less than 10 percentage points), reflecting relatively high labor force participation rates among working-age women. In South Dakota, for example, 80 percent of working-age women were in the labor force, compared with 71 percent of women nationwide. The gender gap in South Dakota’s labor force participation rates was only 6 percentage points in 2005.
The high female labor force participation rates in these northern Midwest states are linked to women’s educational attainment in the region. In South Dakota, for example, 90 percent of women ages 25 and older have completed high school, compared with 85 percent of adult women nationwide. However, the proportion of women with advanced or professional degrees in this region is below the national average. Many people have left the region to pursue higher-paying jobs in other states; in recent years, South Dakota and neighboring states have ranked near the bottom in terms of women’s median annual earnings.10
The rise in female labor force participation has been a key step toward gender equality both at home and in the workplace, but closing the labor force gap is only part of the story. Women are still underrepresented in higher-paying positions, especially in the natural and physical sciences, mathematics, and engineering. Women currently account for nearly one-half of the total U.S. labor force but only one-fourth of the science and engineering labor force. Science and engineering employment accounts for a relatively small proportion of the U.S. labor force, but is important as an engine for higher earnings, innovation, and economic growth. Closing the gender gap in this sector is one way to ensure a strong and competitive U.S. economy.
