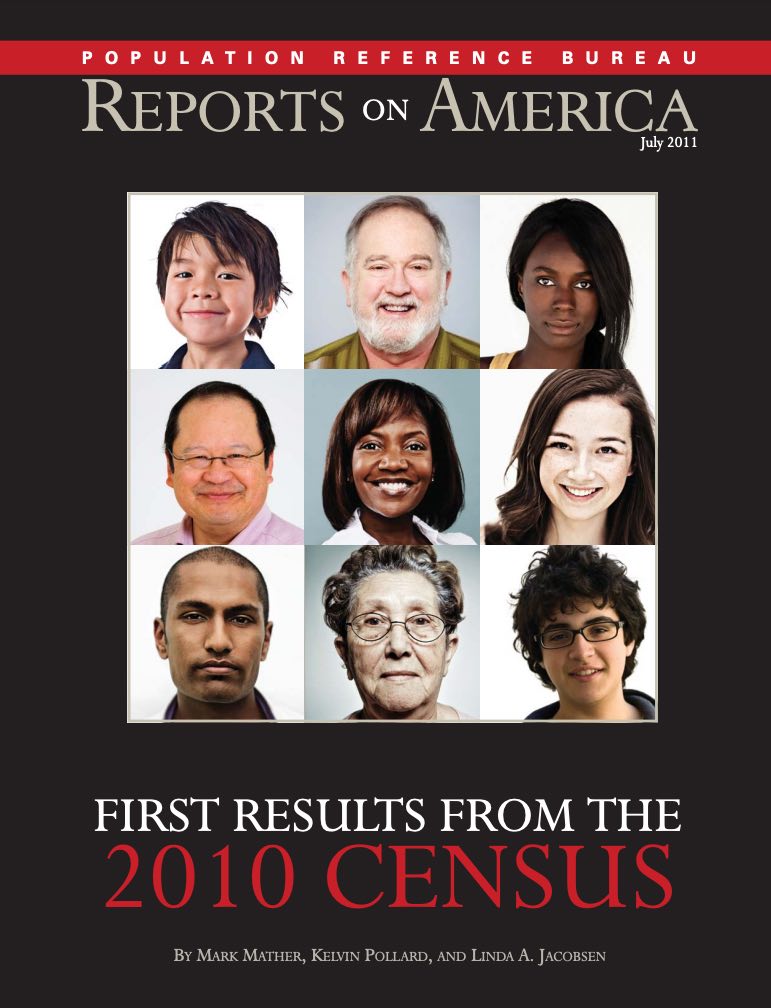
First Results From the 2010 Census
Product: Reports on America
Authors: Mark Mather Kelvin Pollard Linda A. Jacobsen
Date: July 12, 2011
(July 2011) PRB Reports on America: “First Results From the 2010 Census” looks at demographic trends in the U.S. population since 2000.
Here are 10 key findings about how the U.S. population has changed:
- On April 1, 2010 there were 308.7 million people living in the United States. Although the pace of population growth slowed relative to the 1990s, the increase in population from 2000 to 2010—at 27.3 million—represents the third-largest increase in U.S. history.
- In 2010, children under age 18 made up 24 percent of the U.S. population—an all-time low. Population aging is not unique to the United States and in many developed countries—including Japan, France, Germany, and Canada—the share of the population under age 18 is substantially lower than in the United States.
- The decennial census has historically missed a higher percentage of minorities and children, and this trend continued in 2010. Results from the Census Bureau’s demographic analysis show that 2010 Census enumeration may have missed 2.5 percent of African Americans and 1.7 percent of children under age 18.
- In 2010 there were 50 million Hispanics living in the United States, making up nearly one in six U.S. residents. The Latino population increased 43 percent since 2000 and has more than doubled since 1990. Overall, minorities accounted for 92 percent of the total U.S. population growth during the past decade, and Hispanics accounted for over half of the increase.
- In the United States, racial/ethnic minorities are not evenly distributed across age groups. While nearly half of the population under age 18 are racial/ethnic minorities, two-thirds of the voting-age population is non-Hispanic white.
- Since the 1950s, the population has shifted to the South and West—and this trend continued over the last 10 years. For the first time, the West has overtaken the Midwest as the second most-populous census region—just as it overtook the Northeast 20 years earlier.
- Across the country, population growth slowed with the lagging economy, and unlike the 1990s, when every state gained population, Michigan’s population declined between 2000 and 2010. Among the 50 states, Nevada had the fastest population growth rate (35 percent), while Texas had the largest numerical increase (4.3 million).
- Areas with the fastest growth included suburbs of metropolitan areas in the South and West, such as the region around Orlando, Fla.; the “Research Triangle” area of North Carolina; the northern Virginia exurbs of Washington, D.C.; and the areas surrounding such cities as Las Vegas, Atlanta, and several cities in Texas (Houston, Dallas-Fort Worth, San Antonio, and Austin). As in previous decades, many rural areas lost population, including much of the Great Plains and northern and central Appalachia. In fact, nearly half of the 1,104 counties that lost people during the 2000s were counties that were isolated from metropolitan areas and had small or nonexistent urban populations.
- Within metropolitan areas, most U.S. population growth during the past century has taken place in suburban areas, rather than central cities. In the last decade, however, the population living in central cities has rebounded somewhat, registering an increase of 3 percentage points. One-third of the U.S. population now lives in central cities, the highest proportion since 1950.
- Racial/ethnic diversity is increasing in local areas across the United States. Results from the 2010 Census show that 11 percent (341) of the country’s 3,143 counties already have become “majority minority”—less than 50 percent non-Hispanic white. And another 225 counties have reached the “tipping point” toward becoming majority minority sometime in the next decade: Between 40 percent and 50 percent of the population in those counties are minorities.
First Results From the 2010 U.S. Census: Four Key Findings
In this video, Mark Mather, associate vice president, and Linda A. Jacobsen, vice president, Domestic Programs at PRB discuss four key tables and figures from the report:
- Europe’s population growth was one-sixth the growth of the United States from 2000 to 2010.
- Children are much more likely to be racial/ethnic minorities than adults.
- Most U.S. population growth during the past century has taken place in suburbs, rather than central cities.
- County population change varies widely within states.
This report was written by Mark Mather, associate vice president, Domestic Programs, at PRB; Kelvin Pollard, senior demographer; and Linda A. Jacobsen, vice president, Domestic Programs.

 ">
">