Hispanics Account for Almost One-Half of U.S. Population Growth
Date
February 1, 2006
Author
(January 2006) With a population growth rate of nearly 1 percent a year, the United States is the fastest growing developed country in the world. While many European countries are facing population decline, the U.S. population is growing as fast as or faster than many developing countries. And the total population of the United States (currently at 296 million) is expected to reach 300 million some time this summer—and about 450 million by the year 2050.
A relatively high birth rate and high rates of immigration are usually credited as the reasons for the United States’ comparatively rapid population growth. Women in the United States average about two children each—far higher than most European countries—and 1.2 million people immigrate into the country annually. But exactly how do those factors interact to produce continuing population growth?
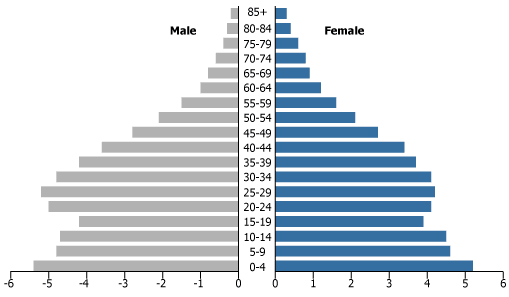
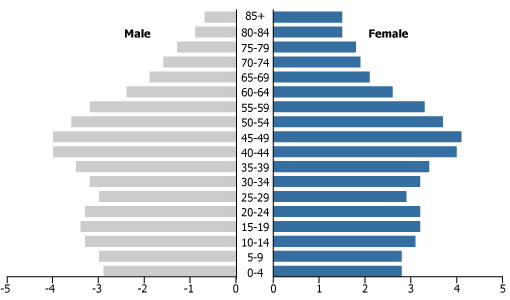
The answer—that the number of U.S. Hispanics is growing faster than any other racial or ethnic group—uncovers some surprising aspects to both present and projected population change in the United States. While the population pyramid for white non-Hispanics in the United States resembles those of European countries, the relative youth of the U.S. Hispanic population means that it will supply much of the U.S. population growth for decades to come (see figure).
Hispanic and White Non-Hispanic Population by Age and Sex, 2004
Hispanic Population

White Non-Hispanic Population

Source: United States Census Bureau.
Relative Youth of the U.S. Hispanic Population
Any population grows or declines as a result of only two components: natural increase or decrease, and net immigration. The level of natural increase or decrease is a direct result of the birth rate, the mortality rate, and the proportion of the population in the older age groups where mortality is typically higher. Net immigration, on the other hand, is obviously the difference between the number of immigrants entering the country and the number of emigrants leaving it.
From 2000 to 2004, the U.S. Census Bureau’s Population Division estimated that total U.S. population increased by a little more than 12 million (see table). That growth is equivalent to adding the population of three Irelands or another state of Pennsylvania. Of that growth, 56.4 percent resulted from natural increase and 43.6 percent from net immigration (including legal and illegal immigrants).
U.S. Population Change, 2000 to 2004
|
Race/Ethnicity
|
Population change
(thousands) |
Natural increase
(thousands) |
Net migration (thousands)
|
|
|---|---|---|---|---|
|
Births
|
Deaths
|
|||
| Total population |
12,231
|
17,198
|
10,297
|
5,330
|
| Black |
1,797
|
2,624
|
1,237
|
410
|
| American Indian/ Alaska Native |
161
|
168
|
47
|
41
|
| Asian |
1,737
|
697
|
154
|
1,194
|
| Native Hawaiian/Other Pacific Islander |
43
|
28
|
5
|
20
|
| Hispanic |
6,016
|
3,726
|
454
|
2,744
|
| White Non-Hispanic |
2,264
|
9,629
|
8,366
|
1,001
|
Source: U.S. Census Bureau, Cumulative Estimates of the Components of Population Change by Race and Hispanic or Latino Origin for the United States: April 1, 2000 to July 1, 2004 (NC-EST2004-05): table 5, accessed at www.census.gov.
Looking at the figures at the bottom of the table first, we see a striking contrast. The white non-Hispanic population of the United States, generally considered to be the traditional majority population at 67 percent, accounted for only 18.5 percent of the country’s population increase between 2000 and 2004. The U.S. Hispanic population accounted for 14 percent of the population, but 49.2 percent of the four-year population increase. This surprising fact reflects a good bit about each group’s demographic composition.
Notice the tremendous dissimilarity in the vital index—the ratio of births to deaths—in these two populations. The vital index among white non-Hispanics is 1.2 (approximately one birth for every death). Among Hispanics, the same ratio is 8.2—approximately eight births for every Latino death. This disparity results from the considerable differences in age structure and fertility between the groups.
The total fertility rate in the United States (TFR)—the average number of children a woman bears —is 1.85 for white non-Hispanics and 2.80 for Hispanics. While the TFR of white U.S. women would be among the highest in Europe, it is still below the two-child level required for replacement of the population.
A Tale of Two Pyramids
But the more important explanation for the large gap in the vital index between whites and Hispanics lies is the proportion of older people (age 65 or older). Among whites, 15 percent are age 65 and over. For Hispanics, it is 5 percent.
The contrast in age structure between Hispanics and non-Hispanic whites is evident in the two population pyramids in Figure 1. The pyramid for whites looks very much like European countries such as Germany. The size of the youngest age groups as one moves up this pyramid is progressively smaller. Further, the white population is clearly more concentrated in the older age groups, groups that will soon include aging baby boomers.
In contrast, the pyramid for U.S. Hispanics more closely resembles that of a developing country, with a widening top due to a higher birth rate as well as immigration of working-age adults with children. Younger working ages are clearly more male, while the pyramid shows no sign at all of a baby boom. Finally, the relatively smaller proportion of Hispanics in the upper age groups shows why there are relatively few deaths in this population.
Looking at other groups, between 2000 and 2004 both African Americans and Asian Americans contributed about 29 percent of U.S. population growth. For Asians, however, immigration made up a much larger proportion of their share of population growth. For blacks, higher TFRs (averaging 2.0 for the period) remained a far more significant component.
Change Is Constant in U.S. Population Growth
The United States is experiencing significant demographic change, growing more and more “minority” and less “majority.” Then again, the ethnic makeup of the country has been changing since its inception. Benjamin Franklin once fussed that so many Germans were settling in Pennsylvania that it might become a foreign country. Policymakers also worried over the influx of Eastern and Southern Europeans in the early 20th century—worries are now focused on immigrants from Asia and Latin America. The United States has always been a multicultural nation—and, by all appearances, will continue to be so.
Carl Haub is senior demographer and holder of the Conrad Taeuber Chair of Population Information at the Population Reference Bureau.
