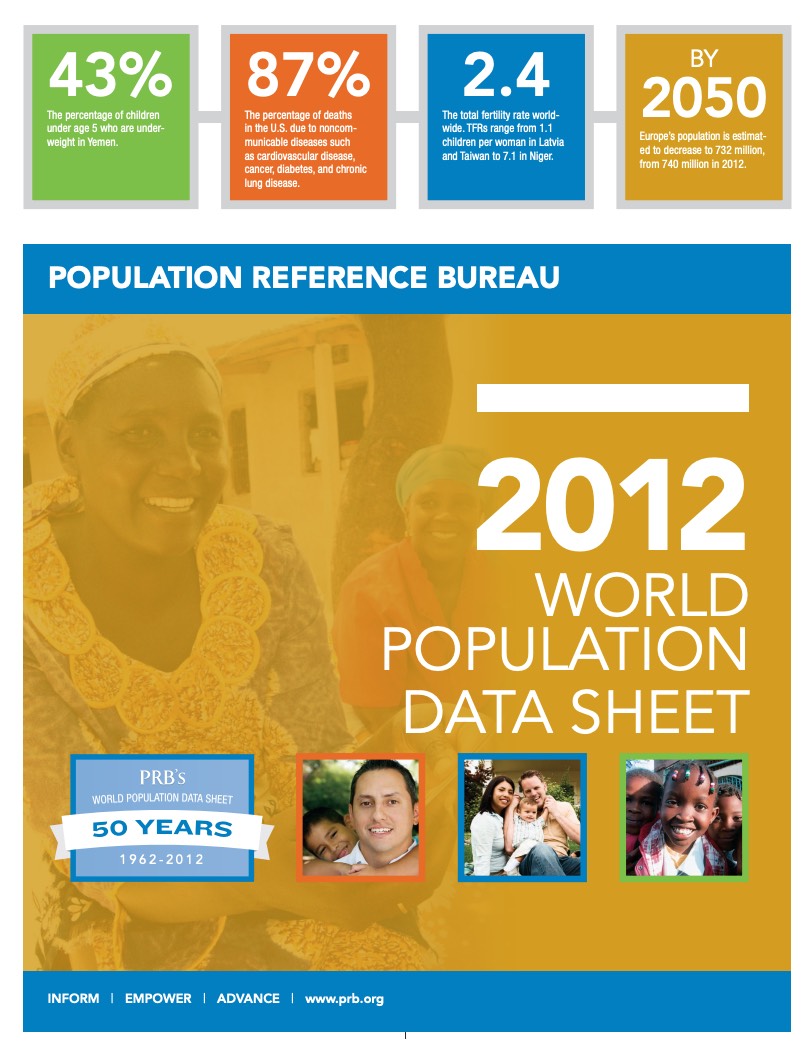
PRB's 2012 World Population Clock
Focus Area
(July 2012) This population clock reflects data from PRB’s 2012 World Population Data Sheet.
| Measure | World | More Developed Countries | Less Developed Countries | Less Developed Countries (excluding China) |
|---|---|---|---|---|
| Population: | 7,057,075,000 | 1,234,018,000 | 5,814,057,000 | 4,463,679,000 |
| Births per: | ||||
| Year | 140,541,944 | 13,923,718 | 126,618,226 | 110,508,216 |
| Month | 11,711,829 | 1,160,310 | 10,551,519 | 9,209,018 |
| Week | 2,702,730 | 267,764 | 2,434,966 | 2,125,158 |
| Day | 385,046 | 38,147 | 346,899 | 302,762 |
| Hour | 16,044 | 1,589 | 14,454 | 12,615 |
| Minute | 267 | 26 | 241 | 210 |
| Second | 4.5 | 0.4 | 4.0 | 3.5 |
| Deaths per: | ||||
| Year | 56,238,002 | 12,191,662 | 44,046,340 | 34,404,641 |
| Month | 4,686,500 | 1,015,972 | 3,670,528 | 2,867,053 |
| Week | 1,081,500 | 234,455 | 847,045 | 661,628 |
| Day | 154,077 | 33,402 | 120,675 | 94,259 |
| Hour | 6,420 | 1,392 | 5,028 | 3,927 |
| Minute | 107 | 23 | 84 | 65 |
| Second | 1.8 | 0.4 | 1.4 | 1.1 |
| Natural Increase per: | ||||
| Year | 84,303,942 | 1,732,056 | 82,571,886 | 76,103,575 |
| Month | 7,025,329 | 144,338 | 6,880,991 | 6,341,965 |
| Week | 1,621,230 | 33,309 | 1,587,921 | 1,463,530 |
| Day | 230,970 | 4,745 | 226,224 | 208,503 |
| Hour | 9,624 | 198 | 9,426 | 8,688 |
| Minute | 160 | 3 | 157 | 145 |
| Second | 2.7 | 0.1 | 2.6 | 2.4 |
| Infant Deaths per: | ||||
| Year | 5,779,276 | 72,128 | 5,707,148 | 5,441,172 |
| Month | 481,606 | 6,011 | 475,596 | 453,431 |
| Week | 111,140 | 1,387 | 109,753 | 104,638 |
| Day | 15,834 | 198 | 15,636 | 14,907 |
| Hour | 660 | 8 | 652 | 621 |
| Minute | 11 | 0.1 | 11 | 10 |
| Second | 0.2 | 0.002 | 0.2 | 0.2 |
Source: Carl Haub and Toshiko Kaneda, 2012 World Population Data Sheet (Washington, DC: Population Reference Bureau, 2012). Numbers may not add to totals due to rounding.

 ">
">