Carl Haub
Demographer Emeritus

July 8, 2009
Demographer Emeritus
Speculation has been rife in the media on the possible effect of the current recession on the U.S. birth rate.
In January of this year posed this same question but now, at mid-year, unemployment is approaching 10 percent for the first time in over a quarter century, the housing “bubble” has truly burst, banks and industries that have been pillars of the economy have gone bankrupt, and consumer confidence has reached one of its lowest points in the past 50 years.
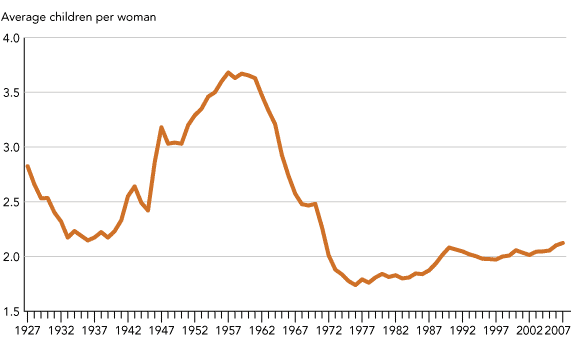
The U.S. birth rate has exhibited some remarkable swings over the past 80 years (see Figure 1).1 Two record low points occurred during two periods of serious economic crisis: the Great Depression and the somewhat less traumatic “oil shock” inflationary period of the 1970s. It is thus logical to speculate that the current period of stark economic reality and the resultant apprehension for the future will see a similar decline in births.
The U.S. birth rate reached an all-time low in 1936 when the TFR fell to 2.1 children per woman in the wake of the stock market crash of 1929. The next low occurred in 1976 when the TFR fell to another record low of 1.7. It then remained at about 1.8 for the first half of the 1980s, possibly held in check by the milder 1980s’ recession, before slowly climbing to today’s 2.1. The U.S. TFR is among the very highest of the developed countries and at a level that many low fertility countries, such as those of Europe, Japan, and South Korea, would very much like to achieve.

Source: National Center for Health Statistics.
But will past be prologue? To what extent were economic downturns of the past really responsible for the record low birth rates of their era? In the 1920s, the TFR had already been declining rather sharply. The decrease continued at much the same pace until it hit bottom in 1936. But the question is, would it have continued down to that all-time low of 2.1 or would it have stopped declining sooner were it not for the Depression?
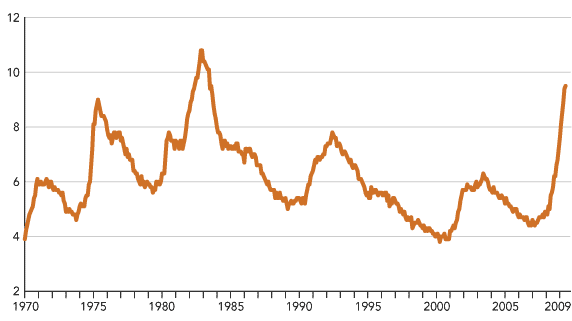
Similar questions can be asked regarding the 1970s. The social setting was, of course, quite different from the 1930s. Feminism was emerging, new methods of contraception had become available, and the national legalization of abortion took place in 1973. For many of these reasons, the late 1960s and 1970s represented a departure from the “baby boom” that had just preceded it when a large proportion of births were unplanned.2 But would the TFR dropped as low as 1.7 without the added impetus of inflation, not to mention long lines at the gas station? While that question can never be definitively answered, we do know that the economic setting hardly seems conducive to starting families or having additional children. Double-digit inflation during the 1970s made two-earner, two-career families a virtual necessity for many. Unemployment passed 8 percent in 1975 while the cost of housing climbed.
What about today? Can a decline in the birth rate be anticipated? In part, an answer depends on just when the current economic crisis—and the media publicity that goes with it—actually started. The unemployment rate remained under 5 percent throughout 2007 but began to rise in early 2008, about the same time that gasoline prices began their climb to $4 per gallon and higher. Any business and industry that could be seriously affected by energy prices began to suffer, particularly automobile manufacturers, airlines, trucking companies, and many more. By the fall of 2008, the housing bubble (generally defined as a sharp rise in housing prices not in line with household income nor inflation) began to burst as more and more homeowners began to default on mortgages.
Percent

Source: U.S. Bureau of Labor Statistics.
If the economic crisis can be given a start date of early 2008, then evidence of a slump in the birth rate might become apparent as early as late 2008 but could not be really conclusive until well into 2009. There is, quite naturally, some time lag in the process. The most recent national data on births available are for the 12-month period ending October 2008. Compared with the 12-month period ending October 2007, births declined by a relatively small proportion, by 0.7 percent. That does, however, represent a reversal since the period ending October 2007 when births were 1.5 percent higher than the previous similar period. The pattern of change in birth rates during these periods was similar.
One U.S. state, Arizona, reports vital data with surprising speed. In the first six months of 2009, the number of births declined to 45,008 from 48,403 in the first six months of 2008, a decrease of 7 percent. If the seasonal pattern of births follows precedent, there would be only about 92,000 births in 2009, compared with 99,215 in 2008 and about 102,000 in both 2006 and 2007. By way of background, the state’s unemployment rate rose from 5.5 percent in June 2008 to 8.7 percent in June 2009 and employment fell by nearly 200,000, a drop of 7.4 percent in just 12 months. It may be that many couples saw it coming.
It is certainly too soon to tell if this economic crisis will result in a sharp drop in the birth rate. But all the measures and indicators, along with the collapse of mainstays of the economy, are much worse than in the 1970s.
