Mark Mather
Associate Vice President, U.S. Programs

May 1, 2008
Associate Vice President, U.S. Programs
(May 2008) Baby boomers, many on the cusp of retirement, are moving out of densely populated states in favor of less populated areas, according to new data from the U.S. Census Bureau.
In 2007, there were approximately 78 million baby boomers—people born between 1946 and 1964—in the United States. The oldest of the baby boomers turned 62 in January, and many have started to exit the labor force. Federal, state, and local policymakers are paying attention because of the potential impact of aging boomers on the U.S. economy, health care, and families. However, the impact of the baby-boom bulge will vary from state to state, and depends in part on migration patterns of boomers as they reach retirement age.
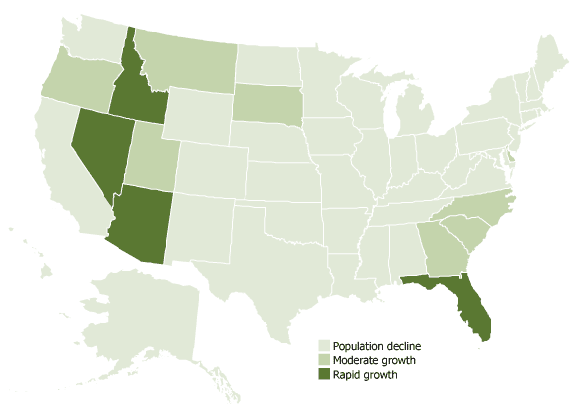
Since 2000, the oldest baby boomers—those closest to retirement age—have moved into several fast-growing states, including Arizona, Florida, Idaho, and Nevada (see Figure 1). Boomers are also moving into North and South Carolina, Delaware, Georgia, Montana, Oregon, South Dakota, and Utah.
Figure 1
Percent Change in the Oldest Baby-Boom Cohort, 2000-2007*

*Oldest baby boomers were those ages 50 to 54 in 2000 and 57 to 61 in 2007. Moderate growth refers to a 0 percent to 4.9 percent increase. Rapid growth refers to a 5 percent or greater increase.
Source: U.S. Census Bureau.
Researchers have found that many older people, as they reach retirement age, prefer to live in areas with lower housing costs, less traffic, and more natural amenities.1 These residential preferences in old age may explain the population gains in the Mountain West, and the corresponding declines in several states in the highly urbanized Mid-Atlantic and Northeast corridor, including Connecticut, Maryland, and New Jersey (a 9 percent decrease for each); New York and Massachusetts (an 8 percent decrease each); Rhode Island (a 7 percent drop); and Virginia (a 6 percent drop).2 The District of Columbia and Louisiana had the biggest declines in older boomers since 2000 (11 percent each).
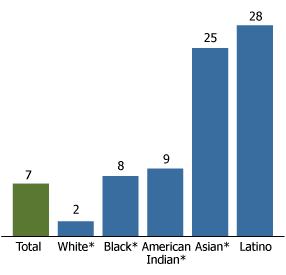
Latinos were the fastest-growing minority group between 2000 and 2007, but Asian Americans were not far behind, according to the new census estimates (see Figure 2).The Latino population increased by 28 percent since 2000, compared with a 25 percent increase among Asian Americans. Overall, minorities have accounted for 83 percent of the U.S. population gain during the decade.
Figure 2
Percent Increase in U.S. Population by Race/Ethnicity, 2000-2007

*Non-Hispanic.
Source: U.S. Census Bureau.
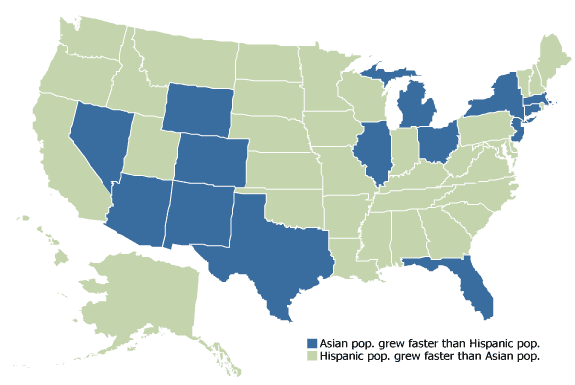
Since 2000, the Asian population has grown faster than the Latino population in 14 states and D.C. (see Figure 3). Many of the states with rapid Asian growth have sizable Latino populations, such as Arizona, New Mexico, and Texas along the Mexico border. In general, states with smaller Asian American populations in 2000 have experienced bigger relative gains during the decade.
Figure 3
Asian vs. Hispanic Population Growth, 2000-2007

Source: U.S. Census Bureau.
Although the Asian American population is numerically smaller than the Hispanic and African American populations, this group is important because of its unique demographic, social, and economic characteristics.
The Asian population has an unusually low dependency ratio. The dependency ratio measures the number of dependents—people ages 65 and older and children under age 18—per 100 people of working age. In 2007, the Asian dependency ratio was 47, meaning that potential workers outnumbered dependents by a ratio of 2:1. The dependency ratios for blacks (60) and Latinos (65) were considerably higher, meaning that those groups had more youth and elderly potentially in need of economic support. Nationwide, the dependency ratio was 59 in 2007.
The high proportion of working-age Asians is linked to U.S. immigration policy, which has provided entry to a large number of highly skilled immigrants from Asia to attend college or work in America’s high-tech workforce. In 2006, more than two thirds of Asian Americans (67 percent) were born outside of the United States, compared with 40 percent of the Latino population.3 The Asian dependency ratio is also kept in check by the relatively low fertility rate of Asian American women (around 1.9 births per woman). The total fertility rate for Hispanic women, at 2.9 births, is considerably higher and contributes to the vastly different age structures of the two groups.4
In general, Asian Americans face fewer economic challenges than other racial and ethnic groups. Asians have the highest median household income of any group ($64,000)—higher than whites, twice as high as blacks, and $25,000 higher than Hispanics. Nearly half of all Asian Americans ages 25 and older are college graduates, compared with only 12 percent of Hispanics. About 35 percent of African American children and 28 percent of Latino children live in poverty, compared with 12 percent of Asian children.5
As a group, Asian Americans are at the top of the socioeconomic ladder, but these figures obscure the tremendous diversity within the Asian American community. The two states with the largest Asian populations in 2007 were California and New York; together, they accounted for 44 percent of the total U.S. Asian population. But the Asian populations in those two states are very different. In New York, Asians are mostly Chinese (39 percent), Indian (26 percent), and Korean (11 percent). In California, they are predominantly Filipino (25 percent), Chinese (25 percent), and Vietnamese (12 percent). Each Asian American subgroup is unique and faces different economic prospects depending on the circumstances of their historical migration to the United States as students, workers, refugees, or asylees.
Mark Mather is associate vice president of domestic programs at the Population Reference Bureau.
