U.S. Economic and Social Trends Since 2000
Product: Population Bulletin, vol. 65, no. 1
Authors: Linda A. Jacobsen Mark Mather
Date: February 22, 2010
This has been a tumultuous decade for the United States. During the first 10 years of the 21st Century, there was a major terrorist attack, a housing meltdown, a severe economic recession, and a significant downturn in the U.S. stock market. Unemployment recently passed the 10 percent mark for the first time since 1983. Household wealth increased somewhat with the stock market gains during the past year, but remains well below prerecession levels. Household net worth dropped by more than $10 trillion during the recession—the largest loss of wealth since the federal government started keeping records of wealth accumulation 50 years ago. Trends in stock market indicators, household wealth, consumer confidence, and labor force participation are widely reported and used to measure the health of the U.S. economy. But less is known about the ways people are adapting to changing economic conditions. In this Population Bulletin, we look beyond employment and income and examine other important aspects of people’s lives, including educational attainment, homeownership, commuting, marriage, fertility, and migration trends. With the close of the decade, it is an appropriate time to review how the U.S. population has changed since 2000.
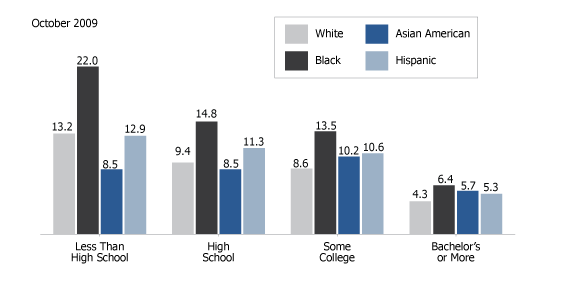
Figure 1
Unemployment Rates by Race/Ethnicity and Education

Source: U.S. Bureau of Labor Statistics.
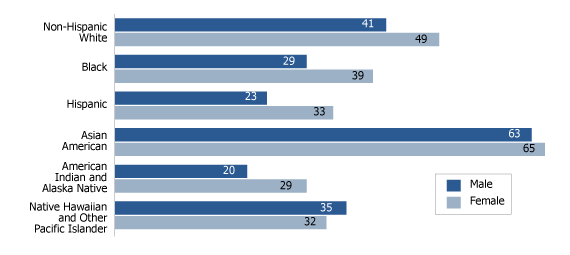
Figure 2
Percent of Persons Ages 18 to 24 Enrolled in College or Graduate School by Race/Ethnicity, 2008

Source: U.S. Census Bureau, 2008 American Community Survey.
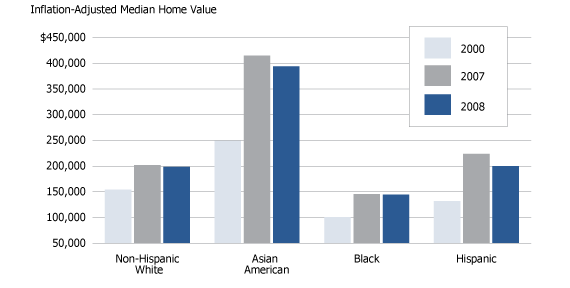
Figure 3
Median Home Value by Race/Ethnicity of Homeowner, 2000, 2007, and 2008

Source: U.S. Census Bureau, 2000 Census and American Community Survey, 2007-2008.
Percent of Persons Who Have Never Married by Sex and Age, 1970, 2000, and 2008
| 1970 | 2000 | 2008 | |
|---|---|---|---|
| WOMEN | |||
| 15-19 | 88 | 94 | 98 |
| 20-24 | 36 | 69 | 80 |
| 25-29 | 12 | 38 | 48 |
| 30-34 | 7 | 22 | 28 |
| 35 and older | 7 | 8 | 10 |
| Total | 21 | 24 | 28 |
| MEN | |||
| 15-19 | 96 | 96 | 99 |
| 20-24 | 56 | 79 | 89 |
| 25-29 | 20 | 49 | 61 |
| 30-34 | 11 | 30 | 37 |
| 35 and older | 7 | 11 | 13 |
| Total | 26 | 30 | 35 |
Source: U.S. Census Bureau, 2008 American Community Survey.

 ">
">