U.S. Racial/Ethnic and Regional Poverty Rates Converge, but Kids Are Still Left Behind
(August 2007) New poverty estimates from the U.S. Census Bureau’s Current Population Survey show that about 36.5 million Americans—12 percent of the population—lived in poverty in 2006. While poverty rates continue to vary widely by subgroup and region, longer-term trends point to a growing convergence in poverty levels among minority groups and for people living in different parts of the country.1
Poverty Rates Drop Among Racial/Ethnic Minorities
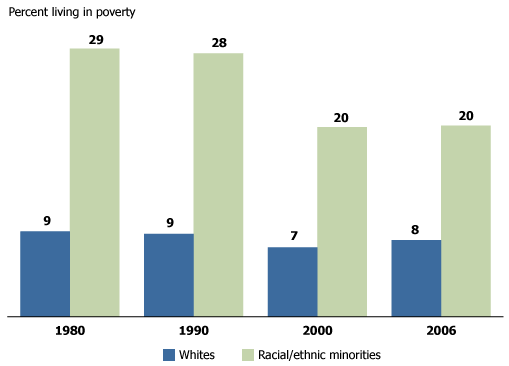
In 2006, there was a substantial gap between the poverty rate of non-Hispanic whites (8 percent) and that of racial and ethnic minorities (21 percent). However, this represents a 7-percentage point decrease in the poverty gap since 1980, when the poverty rate for minorities was much higher, at 29 percent (see Figure 1). The average poverty threshold in 2006 for a family of four was $20,444; for an individual, it was $10,488.2
Figure 1
Poverty Rates by Race/Ethnicity, 1980 to 2006

Source: U.S. Census Bureau, 2007 Current Population Survey.
This economic convergence reflects a large drop in the proportion of African Americans and Latinos who are poor, rather than an increase in poverty among whites. Between 1980 and 2006, the poverty rate among blacks fell from 32 percent to 24 percent. And despite high levels of immigration from Latin America since 1980, the proportion of Hispanics in poverty dropped from 26 percent to 21 percent during the same period. The convergence in poverty rates also reflects the growing U.S. Asian population, which in 2006 had a poverty rate only slightly higher than that of whites. (Asians are categorized as minorities although their socioeconomic profile resembles that of non-Hispanic whites.)
Regional Poverty Rates Converge
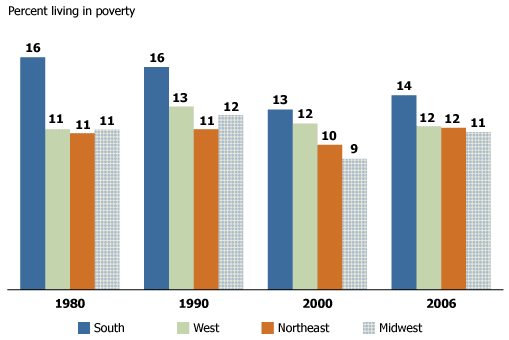
The gap in poverty rates has also narrowed across different regions of the country. In general, states in the South have higher poverty rates than those in the Midwest, Northeast, and West. However, the poverty rate in the South has decreased by 2.7 percentage points over the past 25 years, while poverty rates in other regions have held steady or risen (see Figure 2).
Figure 2
Poverty Rates by Region, 1980 to 2006

Source: U.S. Census Bureau, 2007 Current Population Survey.
The improved economic outlook in the South may reflect a combination of factors: the rapid economic growth in Atlanta and several other large metropolitan areas, improvements in employment opportunities and income among African Americans, and the migration of retirees and working-age families to Southern states from other parts of the country.
New data from the American Community Survey (or ACS, a nationwide annual survey conducted by the Census Bureau) show that between 2005 and 2006, there were 16 states with statistically significant declines in poverty rates among families, including eight in the South: Alabama, Florida, Louisiana, Maryland, North Carolina, Texas, Virginia, and West Virginia.
Child Poverty Rates Remain at 1980 Levels
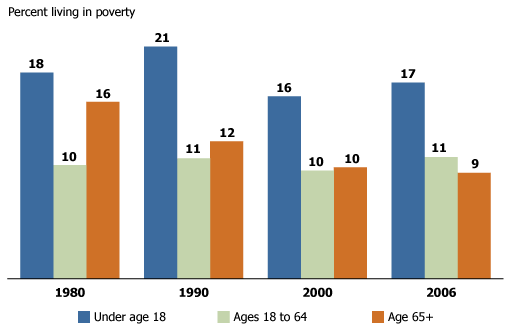
These race/ethnic and regional trends hold promise for future declines in poverty among historically poor subgroups of the population. However, there is at least one group—children under age 18—for whom poverty rates have not declined in a generation or more. The new census estimates show that the poverty rates for children and working-age adults are roughly the same as they were in 1980. In contrast, the poverty rate for the population age 65 and older has decreased considerably over time, from 16 percent to 9 percent between 1980 and 2006 (see Figure 3). In 2006, the child poverty rate (17 percent) was nearly double the rate for elderly Americans.
Poverty Rates by Age Group, 1980 to 2006

Source: U.S. Census Bureau, 2007 Current Population Survey.
Census data show that poverty rates for both non-Hispanic white and minority children have decreased since 1980, yet the total child poverty rate has not budged. These statistics may seem contradictory, but they reflect the growing racial/ethnic diversity of the child population and the economic disadvantage of minority groups relative to non-Hispanic whites. Between 1980 and 2006, the proportion of youth who were racial/ethnic minorities increased from roughly 25 percent to more than 40 percent.4 And in 2006, the poverty rate among minority children (27 percent) was nearly three times the rate for non-Hispanic white children (10 percent). Therefore, the lack of progress in reducing child poverty rates can be attributed, in part, to the rapidly changing composition of the child population.5
Immigration is the main factor driving the changing racial/ethnic composition of the youth population. Since most new immigrants are of reproductive age, many bring their children or start families once they arrive here, boosting the number of U.S. children being born to minority parents. Today, more than one in five U.S. children are either foreign-born or the children of foreign-born parents. Making sure that these children succeed and become productive adults is one way to level the playing field and reduce the poverty rate of future generations.
Mark Mather is deputy director of PRB’s Domestic Programs.
References
- In this article, the 2006 data for whites, African Americans, and Asians include people who selected only one race. In 1980, 1990, and 2000, Current Population Survey respondents did not have the option of selecting more than one race.
- Carmen DeNavas-Walt, Bernadette D. Proctor, and Jessica Smith, Income, Poverty, and Health Insurance Coverage in the United States: 2006 (U.S. Government Printing Office, Washington, DC, 2007).
- Bruce H. Webster, Jr. and Alemayehu Bishaw, Income, Earnings, and Poverty Data From the 2006 American Community Survey (U.S. Government Printing Office, Washington, DC, 2007).
- Mark Mather, “The New Generation Gap.”
- The Population Reference Bureau has collected additional data on child poverty, including state-level estimates, for the Annie E. Casey Foundation’s website at www.kidscount.org/sld/.


