U.S. Science and Engineering Labor Force Stalls, but Trends Vary Across States
This is part of a series of PRB articles about the science and engineering workforce in the United States, funded by the Alfred P. Sloan Foundation. Data for this article are based on the Population Reference Bureau’s analysis of the U.S. Census Bureau’s American Community Survey. More detailed data for states, large counties, cities, and metropolitan areas are available through PRB’s Database on Scientists and Engineers, and through PRB’s DataFinder.
(February 2012) Scientists and engineers make up only about 5 percent of the U.S. labor force, but are viewed as an important engine for higher earnings, innovation, and economic growth.1 PRB’s analysis of data from the American Community Survey shows that the size of the U.S. science and engineering (S&E) labor force has declined from its peak at the turn of the 21st century. However, recent trends in the S&E labor force vary widely in different parts of the United States and for different population groups. And despite a sharp increase in unemployment among S&E workers, the jobless rates for people in most S&E occupations remain well below the national average.
U.S. policymakers pay attention to trends in the S&E labor force because high-tech workers increase our capacity for innovation and ability to compete in the global economy.2 Science and innovation in the United States has led to the creation of new products and technologies, from the cotton gin to the automobile to the iPhone. U.S. scientists and engineers are also attractive to policymakers because they can boost tax revenue, housing values, and consumption of goods and services in the communities where they live and work.3 In 2010, the median annual earnings for people in S&E occupations were $65,000, compared with $31,000 for people in all occupations nationwide.4 This gap in earnings has grown since the onset of the recession, from $31,000 in 2007 to $34,000 in 2010, suggesting that S&E workers were not affected by the economic downturn as much as workers outside of S&E.
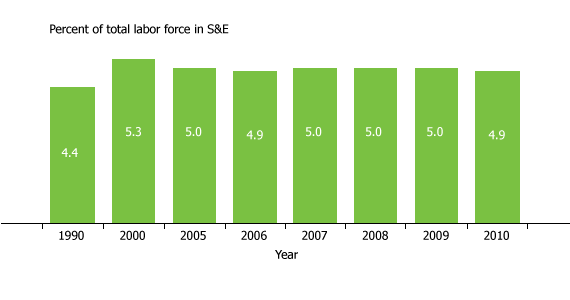
In previous decades, growth in the S&E labor force has outpaced growth in the U.S. labor force as a whole.5 The late 1990s was a period of especially strong economic growth that contributed to a rising demand for high-tech workers. Between 1990 and 2000, the share of the labor force in S&E occupations increased sharply, from 4.4 percent to 5.3 percent (see Figure 1). However, the share of the labor force in S&E occupations leveled off after 2000. Today, the share in the S&E labor force is not much higher than it was 20 years ago. While the U.S. S&E labor force has stagnated in recent years, the global pool of S&E workers has continued to increase—especially in China—so that the U.S. share of the global S&E workforce has declined over time.6
Figure 1
U.S. Science and Engineering Labor Force, 1990-2010

Source: PRB analysis of data from the U.S. Census Bureau’s decennial census and American Community Survey.
Population aging may be one factor contributing to the recent decline in the S&E labor force. Between 2007 and 2010, the share of the S&E labor force ages 55 and older reached 18 percent (up from 13 percent in 2005 and 15 percent in 2007). Thus, there may not be enough young people entering the S&E labor force to offset baby boomers who are reaching retirement age.
Unemployment rates in the S&E labor force are also up sharply. Between 2007 and 2010, the unemployment rate for those in S&E occupations more than doubled, from 2.6 percent to 5.6 percent. However, S&E workers have fared better than those in other occupations during the recession, and had an unemployment rate in 2010 that was well below the national average (10.8 percent).7 Among major S&E occupations, architecture was hit the hardest by the economic downturn. The unemployment rate among architects increased from 2 percent in 2007 to 9 percent in 2010. Unemployment rates have also increased sharply among engineers and mathematicians since 2007.
Between 2007 through 2010 there was also a shift in the composition of the S&E labor force, with more people in computer-related positions and a slight decline in engineering and social science jobs. The share of the S&E labor force in computer-related jobs increased from 44 percent to 46 percent during this period, while the share of engineers fell from 35 percent to 33 percent. The Bureau of Labor Statistics notes that many engineering jobs have been lost in recent years due to globalization and broader declines in manufacturing.8 The share of the S&E labor force working in the social sciences also fell between 2007 and 2010, from 6 percent to 4 percent.
State and Local Patterns
Among the states, Maryland and Virginia had the highest share of its labor force in S&E occupations in 2010 (8 percent each), followed by Colorado, Massachusetts, and Washington (7 percent each). The District of Columbia also had a high proportion of S&E workers (9 percent) because of the large number of federal employees, contractors, and other analysts in the nation’s capital. Among the 50-largest large cities, there were only three where S&E workers made up at least 10 percent of the total labor force in 2010: San Jose (12 percent), Seattle (11 percent), and San Diego (10 percent). This represents a substantial decrease from 2007, when there were six cities with 10 percent or more of their labor force in S&E jobs (Austin, Raleigh, San Diego, San Francisco, San Jose, and Seattle).
State patterns did not change much between 2007 and 2010, but New Jersey experienced a 0.8 percentage-point decrease in scientists and engineers during this period, from 6.4 percent to 5.6 percent. The overall size of the S&E labor force also fell in several states, including New Jersey (-28,000), Michigan (-22,000), and Ohio (-19,000). States with substantial gains in science and engineering between 2007 and 2010 included Texas (+18,000) and Virginia (+19,000).
Women and Minorities
Women have gradually made up a growing share of the S&E labor force, but their gains have stalled in recent years.9 Women made up 26 percent of the S&E labor force in 2010, the same proportion as in 2007. This decline may reflect the increase in computer-related occupations (with high concentrations of men), and the decline in social sciences, which tend to have more women. In 2010, women made up 59 percent of social scientists, 45 percent of mathematicians, and 44 percent of life scientists. Women were underrepresented in architecture (24 percent), computer-related occupations (26 percent), engineering (14 percent), and physical sciences (36 percent).
Racial/ethnic minorities, especially Latinos, make up a growing share of the U.S. population and labor force. In 2010, the U.S. labor force was 12 percent African American and 14 percent Hispanic/Latino. But S&E participation rates for under-represented racial/ethnic minorities have leveled off in recent years. Between 2007 and 2010, the share of African Americans in the S&E labor force held steady at 6 percent, while the share of Latinos increased 1 percentage point, from 6 percent to 7 percent. Asian Americans are the only minority group with above-average representation in S&E occupations (14 percent), and their numbers are increasing. Many Asians migrate to the United States in order to pursue degrees and careers in scientific fields. In 2011, Asian countries accounted for four of the top-five sending countries for international students studying in the United States.10
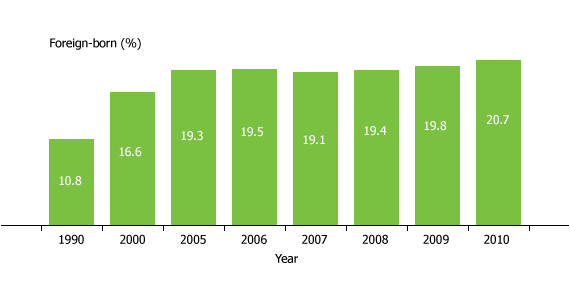
Immigration from Asia has also contributed to a rapid increase in foreign-born workers, especially in S&E occupations. More than 60 percent of foreign-born scientists and engineers in the United States in 2009 were from Asia, mostly from China, India, the Philippines, and Taiwan.11 The foreign-born made up 11 percent of the U.S. science and engineering labor force in 1990. By 2000, this share had increased to 17 percent, and by 2010, it had reached 21 percent (see Figure 2). Policymakers hope to reverse this trend by encouraging more U.S.-born students to work in science and engineering fields. But they face challenges, including the difficulty in recruiting high-achieving students into S&E fields when other high-paying jobs—sometimes requiring less education—may be available.12
Figure 2
Foreign-Born in the U.S. Science and Engineering Labor Force, 1990-2010

Source: PRB analysis of data from the U.S. Census Bureau’s decennial census and American Community Survey.
The changing racial/ethnic composition of the United States also presents challenges. Latinos are the fastest-growing segment of the U.S. labor force, but have lower levels of education and fewer technical skills, on average, than whites or Asians. Boosting educational attainment and interest in technical fields among underrepresented minorities—and women—is one way to increase the share of U.S.-born workers in S&E jobs.
Mark Mather is associate vice president, Domestic Programs, at the Population Reference Bureau. Diana Lavery is research associate, Domestic Programs, at the Population Reference Bureau.
References
- The science and engineering labor force includes people employed or unemployed in computer-related occupations, engineering, architecture, life science, physical science, and social science occupations. This is a broader classification than that used by many other organizations, including the National Science Foundation (see National Science Board, “Scope of the S&E Workforce,” Science and Engineering Indicators 2010, Chapter 3 (Arlington, VA: National Science Foundation) accessed at www.nsf.gov/statistics/seind10/c3/c3s1.htm on Jan. 24, 2012.
- U.S. Department of Labor, Employment and Training Administration, “The STEM Workforce Challenge: the Role of the Public Workforce System in a National Solution for a Competitive Science, Technology, Engineering, and Mathematics (STEM) Workforce,” accessed at www.doleta.gov/youth_services/pdf/STEM_Report_4%2007.pdf, on Jan 24, 2012.
- Mark Mather, “New Database Reveals State Variations in the U.S. Science and Engineering Labor Force,” accessed at www.prb.org/Articles/2007/NewDatabaseRevealsStateVariations.aspx.
- PRB analysis of data from the U.S. Census Bureau’s American Community Survey. Median earnings are not adjusted for inflation.
- National Science Board, “Growth of the S&E Workforce,” Science and Engineering Indicators 2010 (Arlington, VA: National Science Foundation), accessed at www.nsf.gov/statistics/seind10/c3/c3s1.htm, on Jan. 24, 2012.
- National Science Board, “Counts of Global S&E Labor Force,” Science and Engineering Indicators 2010 (Arlington, VA: National Science Foundation), accessed at www.nsf.gov/statistics/seind10/c3/c3s5.htm, on Jan. 24, 2012.
- Unemployment estimates are from the Census Bureau’s American Community Survey.
- Bureau of Labor Statistics, Occupational Outlook Handbook, 2010-11, accessed at www.bls.gov/oco/ocos027.htm#outlook, on Jan. 24, 2012.
- National Science Board, “U.S. S&E Workforce: Trends and Composition,” accessed at www.nsf.gov/statistics/digest12/trends.cfm#3, on Jan. 24, 2012.
- Institute of International Education, Open Doors Data, “International Students: Leading Places of Origin,” accessed at www.iie.org/en/Research-and-Publications/Open-Doors/Data/International-Students/Leading-Places-of-Origin/2009-11, on Jan. 24, 2012.
- PRB analysis of data from the U.S. Census Bureau’s American Community Survey.
- B. Lindsay Lowell et al., “Steady as She Goes? Three Generations of Students through the Science and Engineering Pipeline,” paper presented at the 2009 Annual Meetings of the Association for Public Policy Analysis and Management, accessed at http://policy.rutgers.edu/faculty/salzman/steadyasshegoes.pdf.
