Joseph A. McFalls Jr.
Professor, Villanova University

November 20, 2003
Professor, Villanova University
Editor’s Note: This article is excerpted from PRB’s Population Bulletin, “Population: A Lively Introduction,” 4th edition. A revised version of this Bulletin was released in January 2021, “Population: An Introduction to Demography.”
Individuals relate to society through their families and households. When these units add or lose members — or when the household members grow older, divorce, or marry — there can be profound social and economic consequences. Divorce can bring financial hardship. Marriage can add additional income, as well as stepchildren or mothers-in-law. The birth of a child can bring new financial expenses, but it also can encourage stability.
Households and families are basic units of analysis in demography. They are not the same thing. A household is composed of one or more people who occupy a housing unit.1 Not all households contain families. Under the U.S. Census Bureau definition, family households consist of two or more individuals who are related by birth, marriage, or adoption, although they also may include other unrelated people. Nonfamily households consist of people who live alone or who share their residence with unrelated individuals.
These official definitions do not necessarily reflect changing attitudes about marriage, childbearing, and the roles of men and women. Households that consist of unmarried couples living together and gay and lesbian couples, for example, would be counted as nonfamily households even though they might share many characteristics of a family. If these couples live with children from their current or a previous relationship, the household moves into the family category. The Census Bureau has been exploring new ways to describe and measure Americans’ living arrangements beyond the family/nonfamily dichotomy, with terms such as cohabiting or unmarried couples and POSSLQs (persons of the opposite sex sharing living quarters).2
An individual’s living arrangements usually change at different stages of life. In the traditional scenario, a person starts out in a family household, leaves to create a new household alone or with friends, then forms a family household with a spouse and eventually children. In old age, an individual may live in a single-person household again because of divorce or death of the spouse. Of course, not everyone follows this pattern; many people skip or repeat stages.
The average size and composition of households are highly sensitive to the age structure of the population. But they also reflect social and economic changes. An economic squeeze may prolong the time adult children live at home; a rise in the divorce rate may increase the number of single-person households. Relaxed social rules about marriage may boost the number of unmarried couples setting up house.
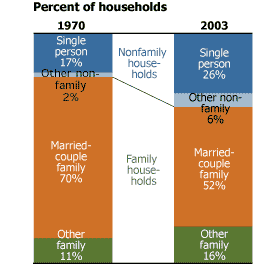
In the United States, the mix of household types has changed enormously over the last three decades. One of the most notable changes is the declining proportion of family households and the rise in single-person households. In 1970, 81 percent of all households were family households, but this was down to 68 percent by 2003.
The retreat from marriage and the general aging of the population are increasing the number of single-person households. Americans are waiting longer to get married, if they choose to marry at all. Married couples are more likely to get divorced than they were in the 1970s. More of America’s elderly live alone after the death of a spouse. In 2003, 26 percent of all U.S. households consisted of just one person, compared with 17 percent in 1970 (see figure). Many European countries have seen a similar rise in single-person households for similar reasons.
U.S. Households, by Composition

Sources: U.S. Census Bureau, “Households by Size: 1960 to Present” and “Households by Type: 1940 to Present, released June 12, 2003;
www.cesnsus.gov/population/socdemo/hh-fam/tabHH-4.xls and www.census.gov/population/socdemo/hh-fam/tabHH-1.xls, accessed Sept. 30, 2003); and PRB analysis of data from the 2003 Current Population Survey (March supplement).
The U.S. baby-boom generation hastened many of the changes in the makeup of U.S. households. When the first of the baby-boom generation entered their late teens and early 20s in the 1960s, they moved out of their parents’ homes and set up their own households, often alone or with housemates. They waited longer to marry than the previous generation, and they were more likely to divorce.
Americans born after the baby boom are delaying marriage even longer. In 1970, 89 percent of women ages 25 to 29 had been married at least once. In 2002, only 60 percent of women ages 25 to 29 had been married. The choices these women make about marriage and childbearing help determine the present and future makeup of U.S. families and households.
This article is excerpted from PRB’s Population Bulletin, “Population: A Lively Introduction,” 4th edition. A revised version of this Bulletin was released in January 2021, “Population: An Introduction to Demography.”
