Russia's Demographic Decline Continues
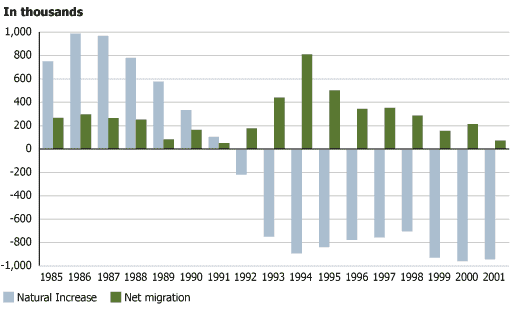
(June 2002) Recently released population estimates for Russia confirm the accelerating population decline that has been underway since the breakup of the Soviet Union more than a decade ago. The Russian population stood at 144 million on January 1, 2002, down 4.3 million from its peak at the beginning of 1992. The pace of natural decrease (the surplus of deaths over births) and slowing migration appears to have intensified since 1998. In each of the last three years, the natural decrease of the population was over 900,000. In 2001, net immigration offset natural decrease by 8 percent, which meant the population fell by 820,000.
Net Migration and Natural Increase in Russia, 1980–2001

Source: State Committee of the Russian Federation on Statistics, Goskomstat Rossii, accessed at www.gks.ru, on June 6, 2002.
Slowing migration fails to compensate for the surplus of deaths over births.
Until 1998, migration into the country compensated for over half of natural decrease, but the flow of returning Russians and Russian speakers appears to be petering out. The recently released population estimates will likely be the last before Russia conducts its first post-Soviet population census in October this year. The results of the census are eagerly anticipated, given Russia’s size and dramatic demographic upheavals over the last decade. Russia will be one of the last countries of the former Soviet Union and Eastern Europe to conduct a post-breakup census.
A combination of pronatalist policies and the anti-alcohol campaign of the 1980s combined to produce a natural increase in the population of nearly one million annually during 1986-87. Since 1987, however, the number of deaths has increased by 720,000 annually, while the number of births has declined by close to 1.2 million.
While the high increases in deaths among middle-aged men from cardiovascular disease and such external causes as murder, suicide, accidents, and poisoning has received the greatest attention, it is actually the decline in the birth rate that has had the greatest impact on population size.
Undoubtedly, the “mortality crisis” among Russian males requires attention. If the goal were simply to stem the population decline, however, it would be prudent to focus on measures to influence fertility. Analysts looking at the intersection of Russian birth and death rates often note that the situation started around the time of Russia’s independence in 1992 and refer to the situation as the “Russian cross.” While coincidental, the rising death rates and falling birth rates are not correlated, and the natural decrease is partly attributable to the aging of the Russian population and the peculiarities in the country’s age structure.
Of the decline in the number of births from 1989 to 1999, about 9 percent can be attributed to decreases in the number of women of prime childbearing age and the remainder to real declines in childbearing. The 1986-88 period was the last time the Russian total fertility rate (TFR) was above 2.1 children per woman — the rate at which couples “replace” themselves in the population. At that time, the birth rate was somewhat artificially stimulated by various pronatalist measures that caused women to accelerate rather than increase their fertility. These measures included extended and paid maternity leave and easier qualification for housing and other benefits. After peaking at 2.19 children per woman in 1987, the TFR fell by more than a child per woman to 1.17 in 1999.
If there is any bright spot in the Russian demographic picture — and there are few — it is that the TFR increased slightly in 2000 to 1.21, the largest such increase since the decline started in the late 1980s. While still far below replacement level, this increase may be an indication that Russian women and couples are adjusting to the “new normal” and feel confident enough about the future to increase childbearing.
With regard to mortality, about 60 percent of the increase in the number of deaths from 1989 to 1999 could be attributed to a growth in the number of older people in the population and the rest to a real increase in mortality that is not age related. For males, only 30 percent of the increase in deaths relate to age.
The persistent male-female life expectancy gap in Russia has been well chronicled. The male-female gap was at its lowest in 1987 at 9.6 years. By 1994, male life expectancy had fallen by 7.3 years, while female life expectancy had declined by less than half of that (3.4 years). At that time, the gap was 13.6 years.
By 1998, life expectancy for both sexes had recovered about half of the decline, and the gap had narrowed to 11.6 years before falling again following the 1998 collapse of the Russian ruble. By 2000, male life expectancy had fallen to 59.0 years and female life expectancy to 72.2 years, with the gap increasing to 13.2 years, nearly back to the level at the depth of the Russian mortality crisis. Thus, it appears that males in Russia are far more susceptible to economic and social dislocations than are females.
While HIV/AIDS has so far not had a dramatic impact on the burden of disease or mortality levels in the country, the officially registered number of HIV/AIDS cases appears to be increasing at an exponential rate, with 100,000 of the 180,000 cases occurring in 2001 alone. Unofficial estimates place these numbers at only one-fifth to one-tenth of the actual figures.
Though a portion of Russia’s demographic crisis should be attributed to the effects of an aging population, the ratio of deaths to births is far higher in Russia than in other countries. In Russia, there are about 1.7 deaths for each birth, while in such aging, low-fertility European countries as Germany, Italy, and Spain, the number of deaths barely exceeds the number of births.
President Vladimir Putin and others are pinning their hopes of stemming Russia’s population decline on increased migration into Russia. More specifically, they would like to see the legal, regulated migration of well educated Russians and Russian-speakers from other former Soviet states to regions in Russia where they are most needed. The return migration of the 25.2 million Russians living “near abroad” has plummeted from its post-breakup peak. In 2001, there was return migration to Russia of only 72,300, less than 10 percent of the 1994 peak when there was a net immigration to Russia of over 800,000 persons. From 1990 to 1999, emigration from Russia to areas beyond the former Soviet states averaged about 100,000 annually. By 2001, this exodus of mostly skilled, educated peoples had fallen by half to 51,400. The net migration exchange with former Soviet countries has had the largest impact on overall migration levels. In the peak year of 1994, 1.1 million people immigrated to Russia from the other former Soviet states. In 2001, this figure had fallen to just 186,200.
Table 1
Demographic Trends in Russia, 1985–2001
| Total population beginning-of-year permanent/ de jure (thousands) | Births (thousands) | Deaths (thousands) | Natural increase (thousands) |
|
|---|---|---|---|---|
| 1985 | 143,528.00 | 2,375.20 | 1,625.30 | 749.9 |
| 1986 | .. | 2,485.90 | 1,498.00 | 987.9 |
| 1987 | .. | 2,500.00 | 1,531.60 | 968.4 |
| 1988 | .. | 2,348.50 | 1,569.10 | 779.4 |
| 1989 | 147,022.00 | 2,160.60 | 1,583.80 | 576.8 |
| 1990 | 147,662.00 | 1,988.90 | 1,656.00 | 332.9 |
| 1991 | 148,164.00 | 1,794.60 | 1,690.70 | 103.9 |
| 1992 | 148,326.00 | 1,587.60 | 1,807.40 | -219.8 |
| 1993 | 148,295.00 | 1,379.00 | 2,129.30 | -750.3 |
| 1994 | 147,997.00 | 1,408.20 | 2,301.40 | -893.2 |
| 1995 | 147,938.00 | 1,363.80 | 2,203.80 | -840.0 |
| 1996 | 147,609.00 | 1,304.60 | 2,082.20 | -777.6 |
| 1997 | 147,137.00 | 1,259.90 | 2,015.80 | -755.8 |
| 1998 | 146,740.00 | 1,283.30 | 1,988.70 | -705.5 |
| 1999 | 146,328.00 | 1,214.70 | 2,144.30 | -929.6 |
| 2000 | 145,543.50 | 1,266.80 | 2,225.30 | -958.5 |
| 2001 | 144,819.10 | 1,308.60 | 2,251.80 | -943.2 |
| Total net migration (thousands) | Total fertility rate | Life expectancy, males | Life expectancy, females | |
|---|---|---|---|---|
| 1985 | 267.2 | 2.1 | 63.8 | 74.0 |
| 1986 | 296 | 2.2 | 64.9 | 74.6 |
| 1987 | 264 | 2.2 | 64.9 | 74.6 |
| 1988 | 251.5 | 2.1 | 64.8 | 74.4 |
| 1989 | 82.9 | 2.0 | 64.2 | 74.5 |
| 1990 | 164 | 1.9 | 63.8 | 74.3 |
| 1991 | 51.6 | 1.7 | 63.5 | 74.3 |
| 1992 | 176.1 | 1.6 | 62.0 | 73.8 |
| 1993 | 440.3 | 1.4 | 58.9 | 71.9 |
| 1994 | 809.6 | 1.4 | 57.6 | 71.2 |
| 1995 | 502.2 | 1.3 | 58.3 | 71.7 |
| 1996 | 343.6 | 1.3 | 59.8 | 72.5 |
| 1997 | 352.6 | 1.2 | 60.8 | 72.9 |
| 1998 | 285.2 | 1.2 | 61.3 | 72.9 |
| 1999 | 154.6 | 1.2 | 59.9 | 72.4 |
| 2000 | 213.6 | 1.2 | 59.0 | 72.2 |
| 2001 | 72.3 | — | 58.6 | 72.1 |
Source: Goskomstat Rossii, State Committee on Statistics of the Russian Federation.
These trends could be rather easily explained by the decline in Russia’s gross domestic product following the 1998 ruble crisis, a development that made Russia less attractive to migrants. Combined with uncertain levels of illegal migration, however, these trends paint a rather complex and murky picture. Figures for the number of illegal migrants in Russia range from 700,000 to an implausible 15 million.
Regardless of the exact numbers, it appears that Russia is becoming at least a migration magnet within the region. Like other migration magnet countries, Russia is encouraging the legal migration of certain groups while discouraging the entry of others and failing miserably at this balancing act. Anecdotal information indicates that most migrants enter Russia legally and stay beyond their allotted time. Most are from the other former Soviet states, but there are also large numbers from Southeast Asia.
In the October 2002 census, a special effort will be made to enumerate the size of this illegal population, their ages, sex, countries of citizenship, and reasons for being in Russia. While the extent of criminality often attributed to groups of illegal immigrants in Russia may be overstated, it is likely that they are living on the fringes of Russian society. If it is the case that many are from outside the former Soviet states and lack Russian language skills, then their incorporation into Russian society may be more problematic. That hardly appears to be what Russia desires.
Timothy Heleniak is research fellow at the Kennan Institute, Woodrow Wilson International Center for Scholars and adjunct professor, Georgetown University.


