PRB Discuss Online: Environmental Change, What Are the Links With Migration?
2008) Close to 200 million people are living outside their country of birth. Increasing numbers are refugees fleeing their homeland for another country.
2008) Close to 200 million people are living outside their country of birth. Increasing numbers are refugees fleeing their homeland for another country.
(2010) Perhaps the greatest satisfaction for a journalist is to see one's reporting produce positive change. Journalists are the link between policymakers and the public, and their role as watchdog is to monitor the actions of government and hold those in charge accountable.
(2010) The concept of "race" has always been controversial, given ugly associations with slavery, the eugenics movement, and racism.
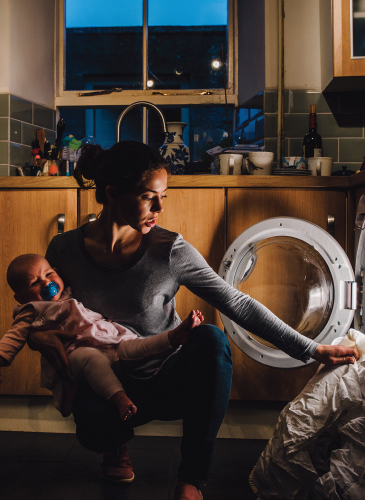
Policy changes could reduce the disproportionate burden of care work on American women, researchers said.
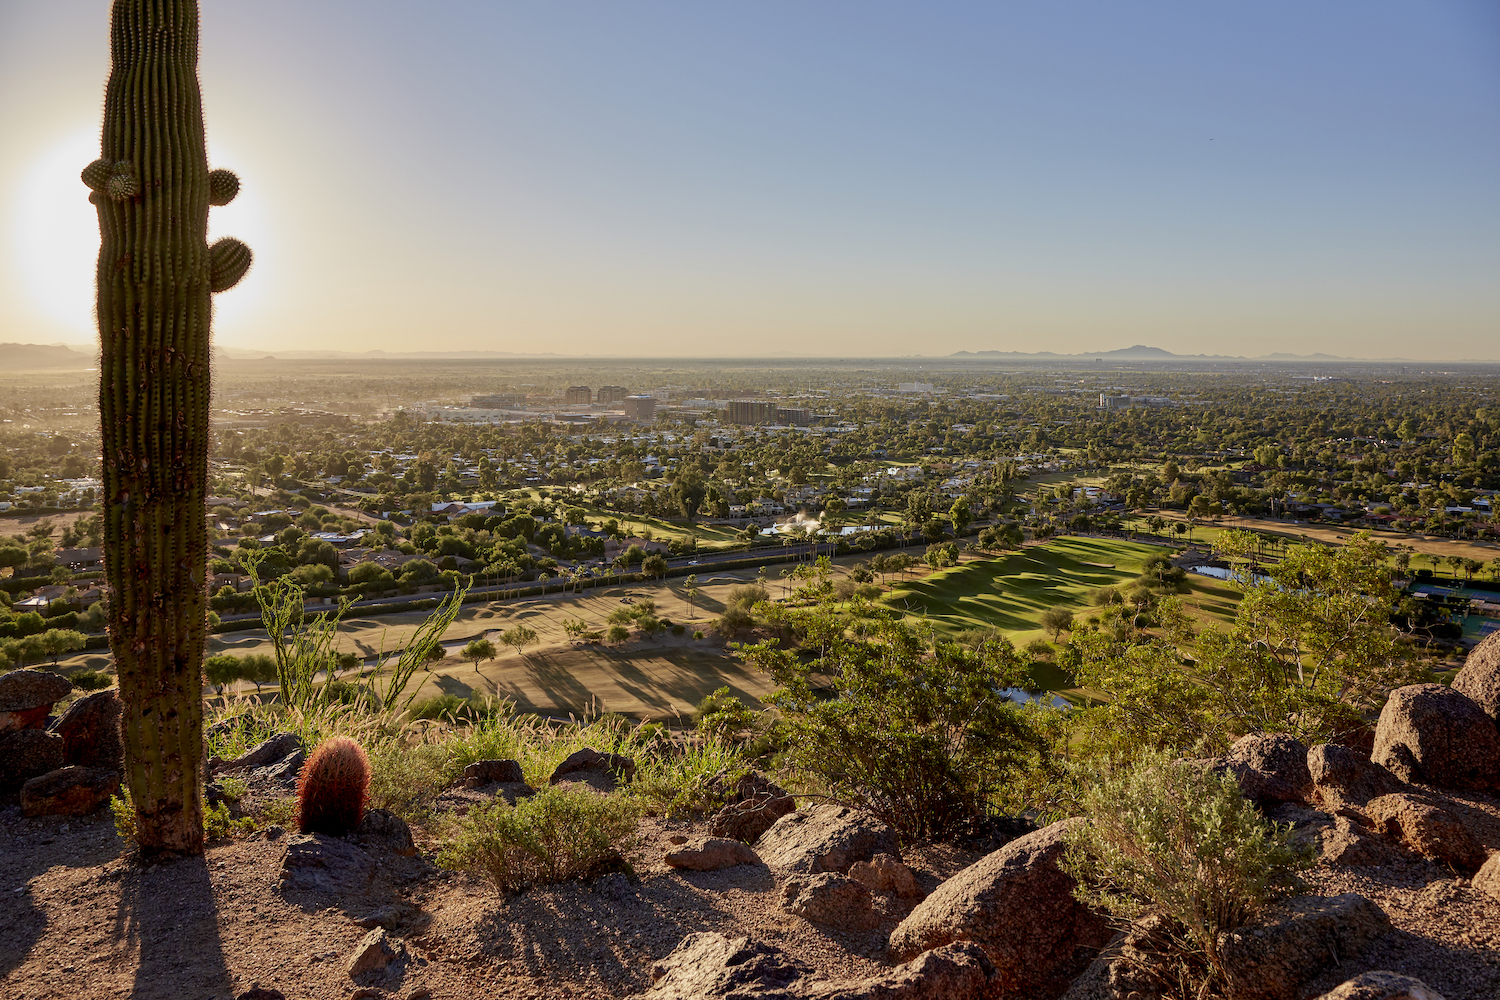
5 takeaways from population data in Arizona and New Mexico
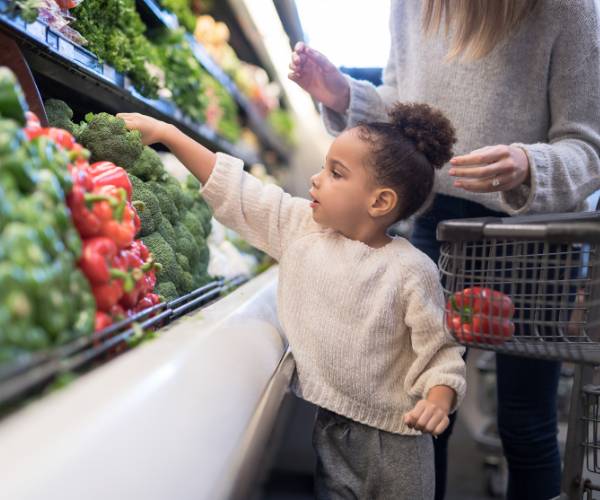
For the youngest Americans, $1 of SNAP payments generates $62+ in economic and health benefits.
(2012) Between 2010 and 2011, the U.S. population increased by 0.7 percent, after averaging 0.9 percent growth each year from 2000 through 2010.1 The United States added just 2.3 million people from 2010 to 2011, compared with 2.9 million from 2005 to 2006, just five years earlier.
When the World Health Organization declared COVID-19 a pandemic on March 11, 2020, few sub-Saharan African countries had reported a single case of the disease, caused by the novel coronavirus SARS-CoV-2.
(2011) Vouchers are frequently mentioned as a promising alternative finance mechanism to achieve a variety of goals in health systems and reproductive health services. Do vouchers work?