459 Search Results Found For : "Comparador seguros coche Costa Mesa CA llama ahora al 888-430-8975 Directorio de aseguradoras Aseguranza de auto Ofertas seguros Se puede asegurar un coche por meses Seguro automotriz online Cuanto sale un seguro de auto"


U.S. Food Stamp Enrollment Rises

(2009) Timely economic data provide the means to assess the severity of the current economic hardship on the U.S. population. Official poverty estimates released on Sept. 10, 2009, by the U.S. Census Bureau show that in 2008, the poverty rate rose to 13.2 percent, and child poverty increased from 18 percent in 2007 to 19 percent, the highest level since 1997.

View Details

Family Planning Use in Central America: Closing the Equity Gap

(2009) Family planning reduces infant and maternal mortality rates by allowing women to plan and space their pregnancies and avoid unintended pregnancies.

View Details

New Database Reveals State Variations in the U.S. Science and Engineering Labor Force

(2007) The database created by the Population Reference Bureau reveals geographic differences in characteristics of people working in the science and engineering (S&E) labor force.

View Details

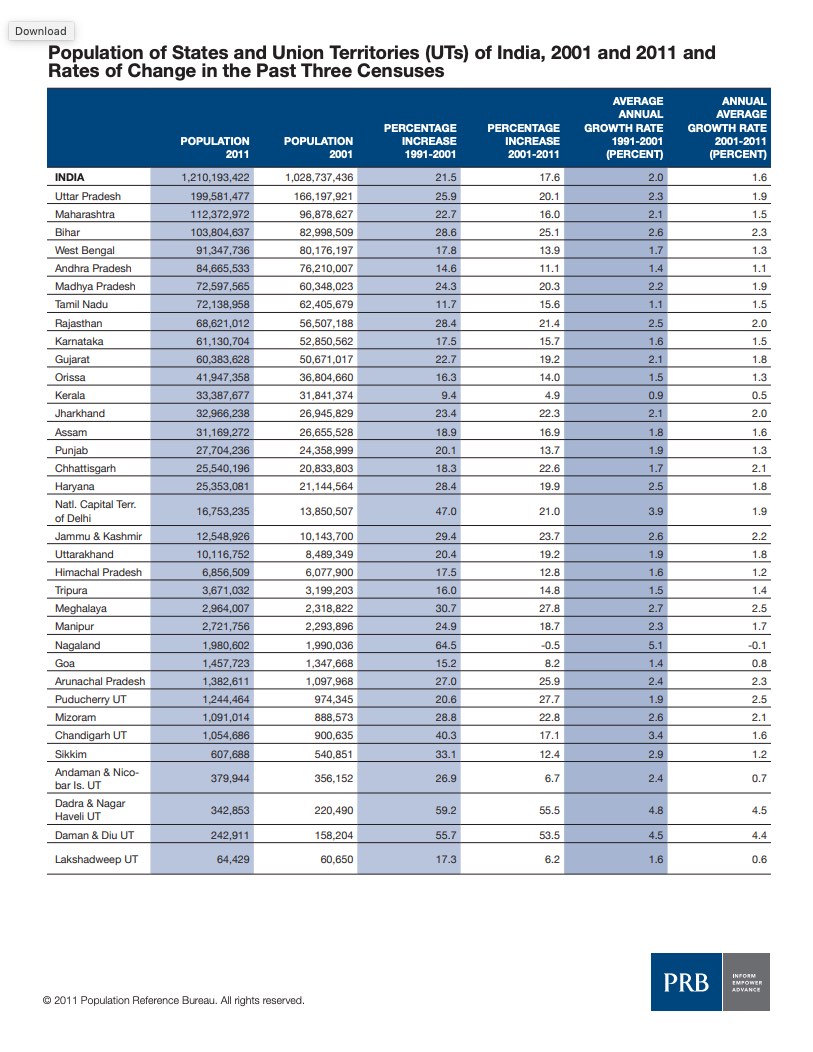
Table: Population of States and Union Territories (UTs) of India, 2001 and 2011 and Rates of Change in the Past Three Censuses

(2011) Together, China and India account for 37 percent of the world’s population. Both countries have conducted censuses over the past year, and when they report their census results, figures such as the widely accepted world population total are at risk of changing.

View Details Array ( [ID] => 9862 [id] => 9862 [title] => india-population-2001-2011 [filename] => india-population-2001-2011.pdf [filesize] => 123121 [url] => https://www.prb.org/wp-content/uploads/2011/04/india-population-2001-2011.pdf [link] => https://www.prb.org/resources/india-releases-latest-census-results-showing-population-catching-up-to-china/india-population-2001-2011-2/ [alt] => [author] => 15 [description] => [caption] => [name] => india-population-2001-2011-2 [status] => inherit [uploaded_to] => 9857 [date] => 2020-12-26 23:55:02 [modified] => 2020-12-26 23:55:02 [menu_order] => 0 [mime_type] => application/pdf [type] => application [subtype] => pdf [icon] => https://www.prb.org/wp-includes/images/media/document.png ) Download (0.1 MB)

Project: Center for Public Information on Population Research (CPIPR)

Opioid Overdose Epidemic Hits Hardest for The Least Educated

(2018) The prescription opioid painkillers that helped fuel the surge in U.S. drug overdose deaths were first approved by the Federal Drug Administration in late 1995.

View Details

Most U.S. Workers Still Driving Alone

(2008) With gas prices soaring, there are reports of more Americans using carpools, public transportation, bikes, and running shoes to make their daily commutes.

View Details

Project: Demography and Economics of Aging and Alzheimer’s Disease

Exploring the Paradox of U.S. Hispanics’ Longer Life Expectancy

(2013) Despite having lower income and education levels, U.S. Hispanics tend to outlive non-Hispanic whites by several years.

View Details

Project: American Community Survey and Decennial Census Support Services

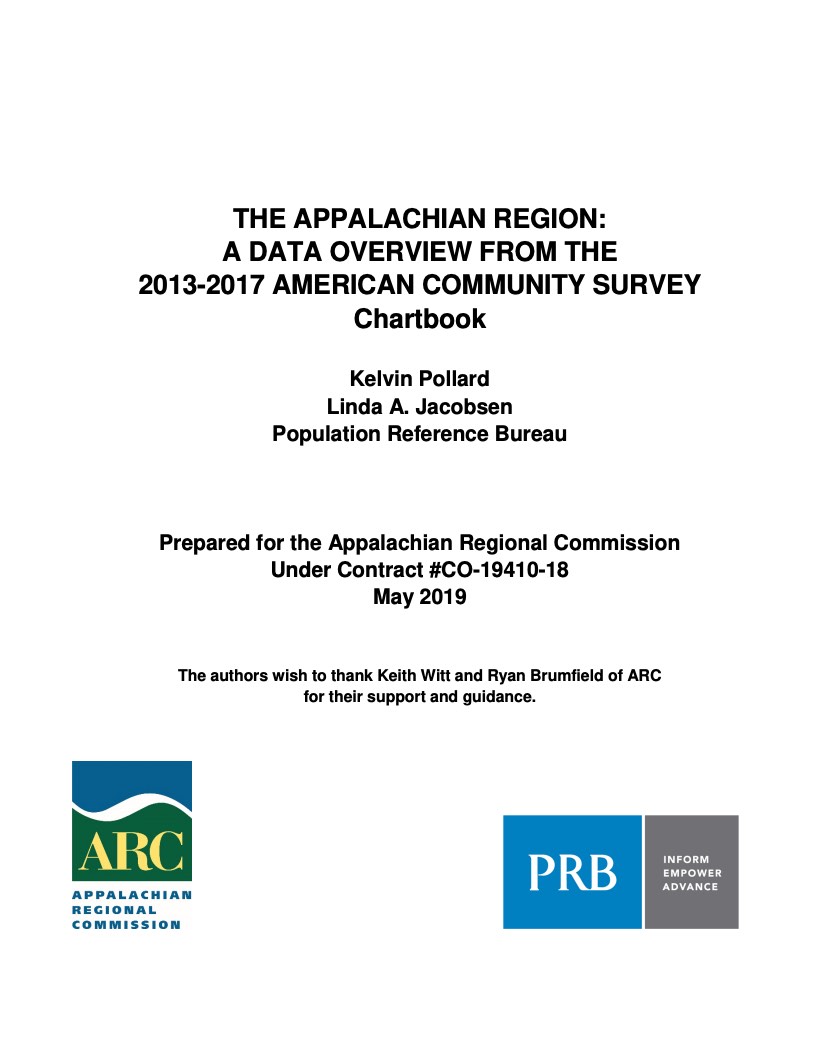
The Appalachian Region Data Overview. ARC Chartbook 2013-2017

Data suggest that Appalachia faces a digital divide—not just between the Region’s households and the rest of the nation but also between the Region’s rural and more urban areas, say the authors of a Population Reference Bureau (PRB) report for the Appalachian Regional Commission.

View Details Array ( [ID] => 8691 [id] => 8691 [title] => PRB_ARC_Chartbook_ACS_2013-2017 [filename] => PRB_ARC_Chartbook_ACS_2013-2017.pdf [filesize] => 42691466 [url] => https://www.prb.org/wp-content/uploads/2019/05/PRB_ARC_Chartbook_ACS_2013-2017.pdf [link] => https://www.prb.org/resources/the-appalachian-region-data-overview-arc-chartbook-2013-2017/prb_arc_chartbook_acs_2013-2017-2/ [alt] => [author] => 15 [description] => [caption] => Appalachian Regional Commission Data Overview, Chartbook 2013-2017 [name] => prb_arc_chartbook_acs_2013-2017-2 [status] => inherit [uploaded_to] => 8679 [date] => 2020-12-19 17:07:26 [modified] => 2020-12-19 17:07:58 [menu_order] => 0 [mime_type] => application/pdf [type] => application [subtype] => pdf [icon] => https://www.prb.org/wp-includes/images/media/document.png ) Download (41.7 MB)

Sex Ratio at Birth Deteriorating Among Asian Immigrants in the United States

(2008) A new study in Proceedings of the National Academy of Sciences reports on a sex ratio that favors boys among U.S.-born children in Indian, Korean, and Chinese families.

View Details