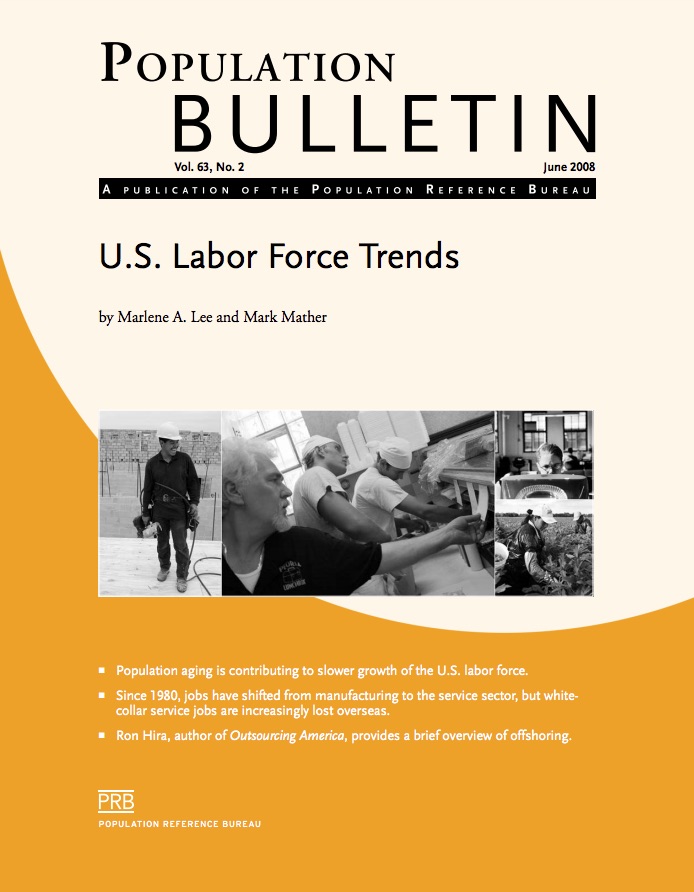
Population Bulletin, vol. 63, no.2: U.S. Labor Force Trends
(2008) During the past four decades, baby boomers coming of age and the rise in women's labor force participation increased the size of the U.S. labor force which, in turn, helped fuel economic growth.
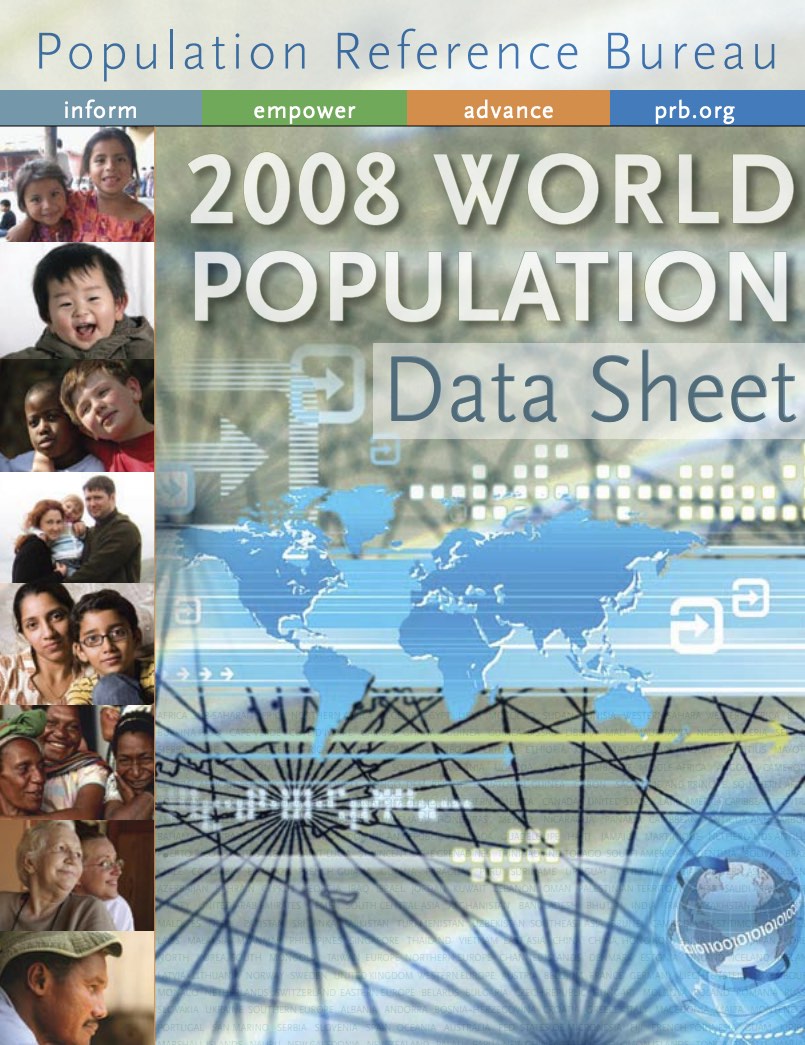
2020 World Population Data Sheet Lesson Plan Slidedeck (PPT)
(2020) PRB’s World Population Data Sheet is an excellent reference and data analysis tool. This series of short activities allows students to access a wealth of data on the world, regions, and individual countries, and develop their data literacy skills and knowledge of geography.
Policy Brief. Understanding Population Projections: Assumptions Behind the Numbers (2014)
Policymakers and program planners rely on population projections to assess future demand for resources such as food, water, and energy, as well as services such as health and education.
(2008) During the past four decades, baby boomers coming of age and the rise in women's labor force participation increased the size of the U.S. labor force which, in turn, helped fuel economic growth.
Lesson Plan. 2020 World Population Data Sheet (PDF)
(2020) PRB’s World Population Data Sheet is an excellent reference and data analysis tool. This series of short activities allows students to access a wealth of data on the world, regions, and individual countries, and develop their data literacy skills and knowledge of geography.
(2008) Hardly a day has gone by over the past few months without a national poll tracking how this year's U.S. presidential race is going. However, the U.S. presidential election actually is a series of 51 contests (50 states and the District of Columbia).
(2020) PRB’s World Population Data Sheet is an excellent reference and data analysis tool. This series of short activities allows students to access a wealth of data on the world, regions, and individual countries, and develop their data literacy skills and knowledge of geography.